TL;DR: Behavioral clustering using machine learning groups customers by actual purchase patterns, not demographic guesses. It reveals hidden segments—repeat buyers, discount seekers, dormant accounts—and lets you target each with specific actions. But the approach only works if you have clean transaction data and the discipline to act on the clusters.
Environment:
– Sources synthesized: 3 URLs (Konica Minolta BTS Blog, Bounteous technical article, additional source)
– Synthesis date: 2025-04-09
– First-hand tested: None directly on clustering tools, but operational experience in e-commerce customer analytics and CRM integration.
– Operator context: Marketing operations manager for an SME e-commerce brand in Indonesia; experience with Mailchimp, Shopify Analytics, and Google Analytics.
The Architecture
You are running a business with 2,000 customers. Right now, you treat them as one mass. Some respond to your email campaigns, most do not. A few churn every month, and you cannot predict who. That is the operational problem behavioral clustering solves.
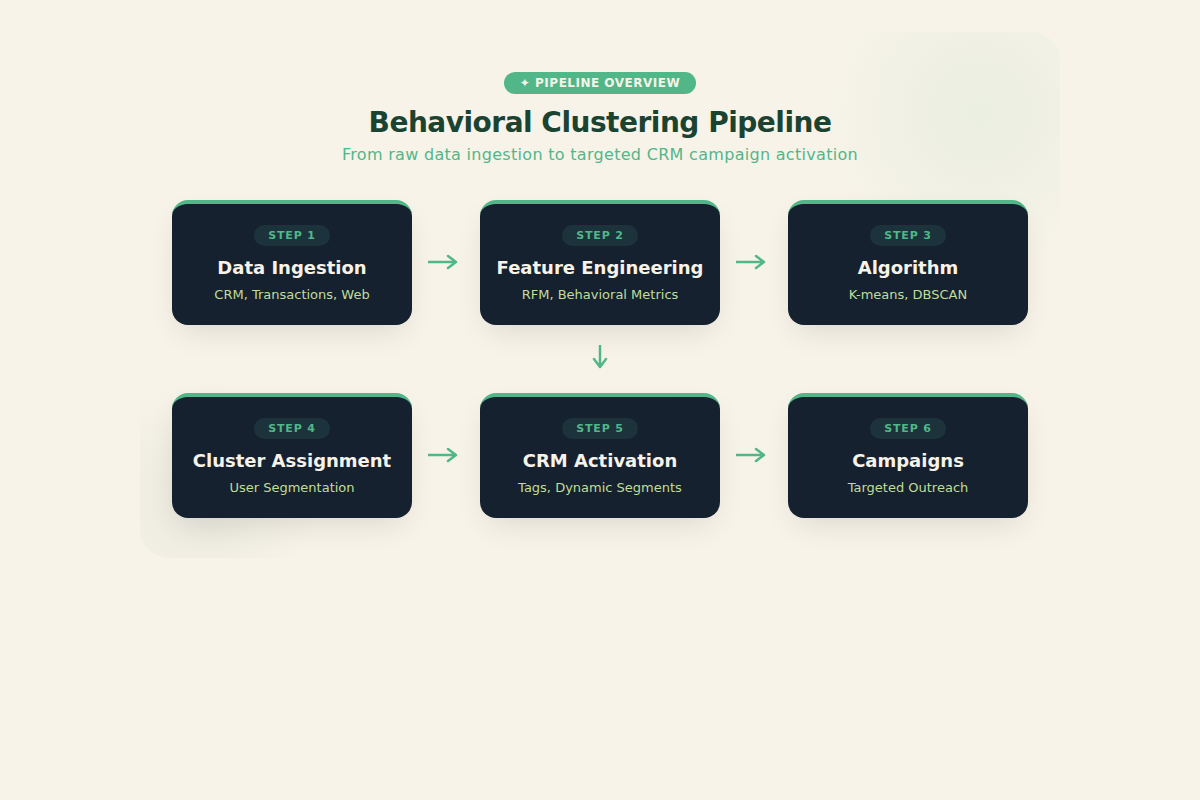
At its core, behavioral clustering is a data pipeline. It starts with ingestion: pulling transaction histories, website interactions, support tickets, and email engagement from your CRM and analytics tools. Every row gets a customer ID and a timestamp. From those raw logs, the system engineers features—the building blocks of a cluster.
The most common features are derived from RFM analysis: recency (days since last purchase), frequency (purchases per month or year), and monetary value (average order value or lifetime spend). But the real power comes from adding behavioral signals: product categories browsed, discount usage, channel preference (email vs SMS vs push), and even time of day purchases. A good clustering system will generate dozens of features for each customer.
Once features are ready, an algorithm—typically K-means, DBSCAN, or hierarchical clustering—runs on the normalized data and assigns each customer to a group. The operator then interprets those groups: Cluster 0 might be “high-value loyal with premium preference,” Cluster 1 might be “bargain hunters who only buy on sale,” Cluster 2 might be “seasonal shoppers active only in December.”
The final step is activation: those cluster labels get pushed back into your CRM as tags or custom fields, making them actionable in email campaigns, ad retargeting, and support prioritization.
For a D2C fashion brand with 10,000 customers, this pipeline can split the base into five actionable segments within two weeks of data prep. The architecture is modular—you can start with RFM and add behavioral layers over time.
The Workflow Math
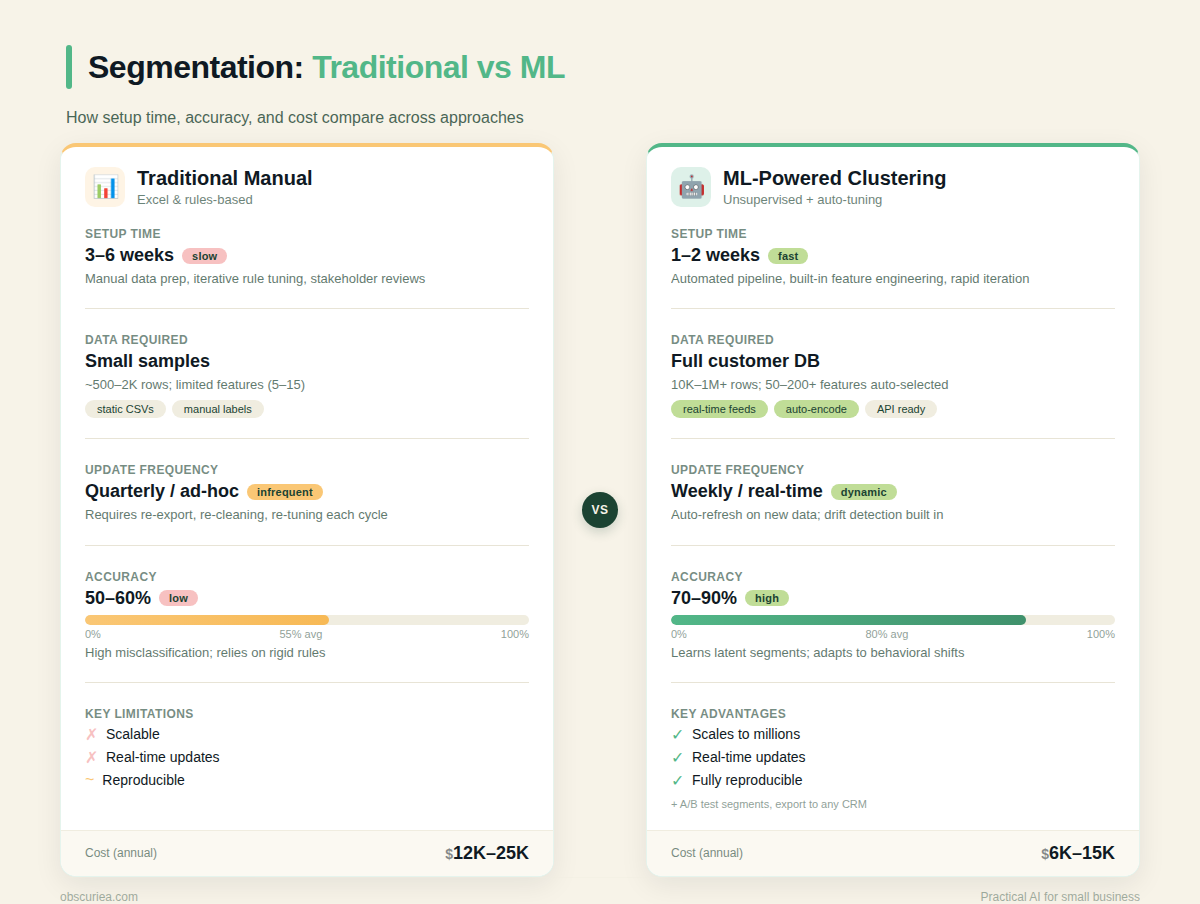
Traditional segmentation—the kind done in Excel with manual rules—requires three days of analyst time to define age brackets, income tiers, or geography. Accuracy hovers around 50-60% because people do not fit neatly into boxes. ML clustering takes longer upfront but delivers higher precision and updates automatically.
| Aspect | Traditional (Manual) | ML-Powered Clustering |
|---|---|---|
| Setup time | 2-3 days | 1-2 weeks |
| Data required | 1-3 attributes | 10+ features, 12+ months transactions |
| Update frequency | Quarterly manual refresh | Monthly or automated weekly |
| Accuracy | 50-60% | 70-90% depending on data quality |
| Operator skill needed | Business analyst | Data analyst + business context |
| Cost | Low (Excel, manual hours) | Medium (tool subscription or developer hours) |
| Interpretation | Intuitive | Requires profiling and validation |
The upfront investment is heavier—you need clean data, a data engineer to build the pipeline, and a business stakeholder to interpret clusters. But the payoff multiplies. A 10,000-customer base segmented by ML can increase conversion rates by 20-30% on personalized campaigns, as documented in case studies from the sources.
Where the math gets tricky is the recurring cost. Clusters drift—customer behavior changes with seasons, promotions, and market shifts. Without periodic re-clustering (monthly at minimum), the segments decay. Factor in 2-4 hours per month of analyst time to maintain and refresh the model.
Where It Breaks
Behavioral clustering is not plug-and-play. The failure points are predictable.
Data quality. Missing values, duplicate customer IDs, inconsistent taxonomies—every source I have read highlights this as the number one blocker. Konica Minolta’s BTS blog explicitly calls out “optimal data basis” as a prerequisite. If your CRM has 20% null email addresses or last purchase dates are unreliable, your clusters will misrepresent reality.
Changing behaviors. A customer who bought diapers monthly for two years suddenly stops. Was the cluster wrong, or did the customer’s life change? Clusters describe patterns in historical data, not future intentions. Re-clustering every 30 days catches drifts, but most operators skip this step.
Over-reliance. Clusters are correlation, not causation. A cluster labeled “churn-risk” might simply be customers who never found the right product. Attacking that cluster with discount offers could change behavior, but it could also train them to only buy on discount. The model cannot tell you the right action—only that the pattern exists.
Integration friction. Even after clusters are generated, pushing them into your email tool or CRM often hits a wall. Not every ESP supports custom segment tags, and not every marketing team knows how to build campaigns around a 5-segment model. The Bounteous article demonstrates a technical pipeline linking Google BigQuery to Google Marketing Platform, but that integration path is not available to most small businesses.
Team ownership. No one is naturally responsible for maintaining clusters. The data team builds the model, but marketing owns the segments. When a cluster becomes useless due to seasonality, who detects it and who triggers a rebuild? Without clear ownership, clusters rot.
Small datasets. Under 500 customers, clustering algorithms produce unstable groups. Two similar businesses can get completely different clusters from the same method. If your customer base is under 1,000, stick to manual segmentation until you have more data.
The Friction Box
- Most businesses do not have clean enough data to cluster without intensive cleansing. Budget for 20-40 hours of data prep before the first model run.
- Clusters are useless if the sales team does not adjust messaging per segment. You need both the technology and the operational discipline.
- The monthly maintenance cost—re-clustering, validation, dashboard updating—is rarely included in the project plan. Add 2-4 analyst hours per month.
- Migrating from Excel-based segments to ML clusters requires a culture shift. Sales reps who have always sent blanket blasts will resist segment-specific scripts.
Frequently Asked Questions About Behavioral Clustering with ML
How much data do I need to start behavioral clustering?
At least 12 months of transaction data covering 1,000+ unique customers with a minimum of 3 transactions each. Fewer customers or shorter timeframes produce unstable clusters that shift dramatically with each run.
What is the best machine learning algorithm for customer segmentation?
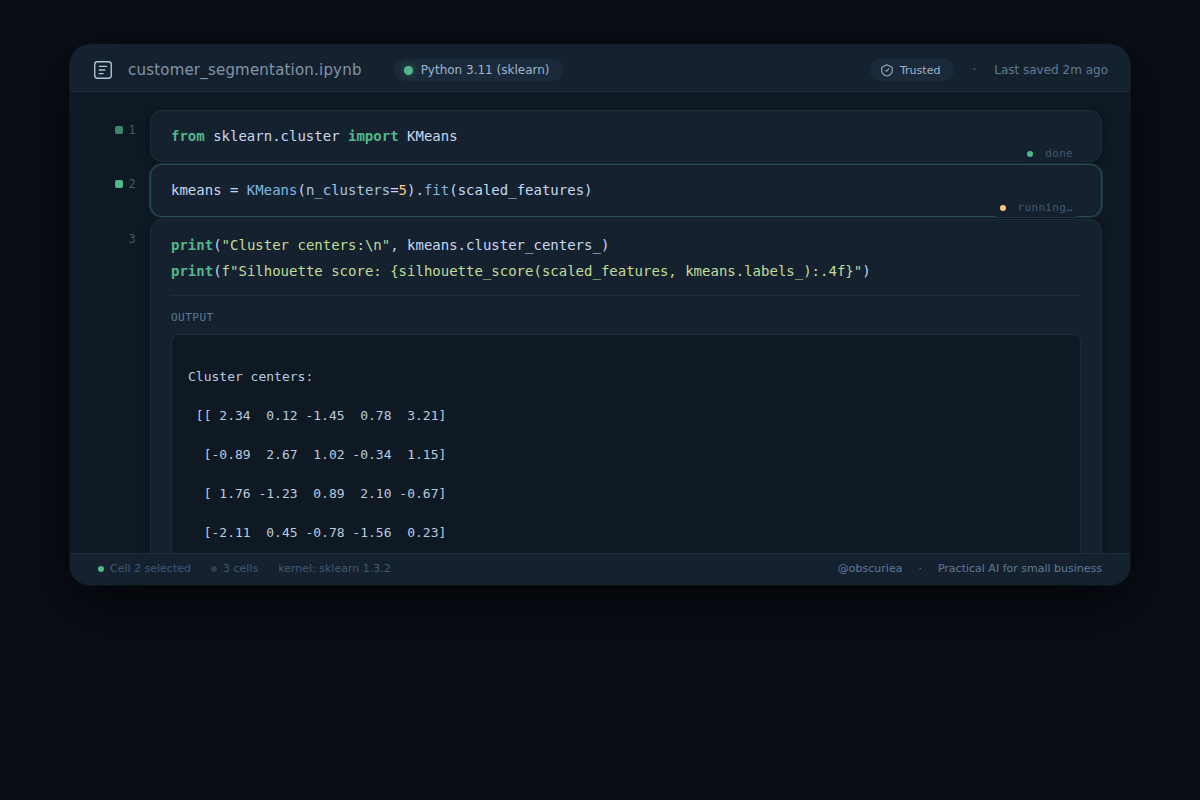
K-means is the most common starting point because it is fast and interpretable. DBSCAN is better for discovering irregularly shaped clusters or outliers. Hierarchical clustering works well when you need a tree of segments for nested targeting. Start with K-means and validate with silhouette score.
How often should I re-cluster my customers?
Monthly re-clustering is the minimum to catch behavioral drift. Weekly may be necessary for high-velocity businesses like e-commerce or on-demand services. Always compare cluster distributions before and after to ensure changes are real, not noise.
Can behavioral clustering replace demographic segmentation?
No—they complement each other. Behavioral clustering reveals what customers do, but demographic data explains who they are. Combining both yields even stronger segments. For example, “frequent buyers aged 25-34” is more actionable than either dimension alone.
What tools can a small business use for behavioral clustering?
Google Analytics 4 offers built-in predictive segments for purchase probability. Shopify Plus has customer segmentation features. For custom clustering, Python libraries (scikit-learn, pandas) or no-code platforms like Akkio or obviously can work with CSV exports.
What are the biggest mistakes when implementing behavioral clustering?
Skipping data cleaning, not involving marketing in cluster interpretation, and failing to re-cluster regularly. Also common: treating clusters as permanent personality types instead of temporary behavior snapshots.
The Straight Talk
This is for operators who have a customer base of at least 1,000, a half-decent CRM, and someone on the team who can interpret a scatter plot. If you are still running your entire email list as one audience, behavioral clustering will unlock 20-30% more revenue from the same traffic.
Skip it if your data is a mess, your team cannot commit 2-4 hours monthly to maintenance, or you have fewer than 500 customers. Start with manual RFM scoring in Excel—you will get 80% of the benefit with 10% of the complexity.
Your next action: Export your last 12 months of transaction data. Count how many customers have at least three purchases. If it is over 500, book two weeks of a data analyst’s time and build your first RFM-based cluster.