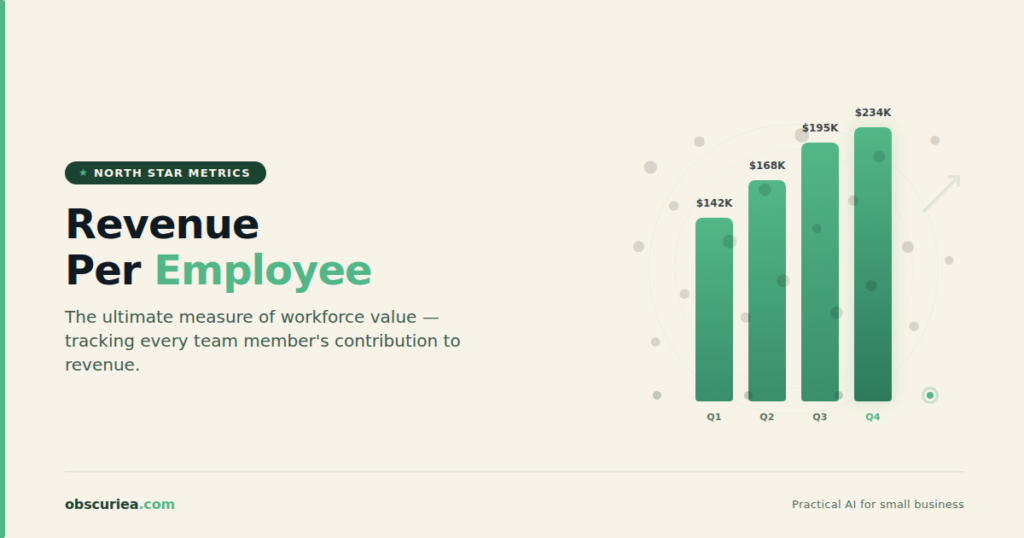
TL;DR: Revenue per employee (APE) is a more operational and actionable North Star metric than revenue itself. It aligns teams with efficiency, highlights hiring discipline, and provides a clear breakeven target. But it’s not foolproof – misuse can lead to underinvestment and shortsighted cuts.
Environment:
– Sources synthesized: TechCrunch, ProductPlan, David Cummings
– Synthesis date: 2026-04-26
– First-hand tested: None (this article synthesizes published analysis)
– Operator context: I’ve studied cloud company economics and advised startups on efficiency metrics for several years, with a focus on SEA growth companies.
The Architecture
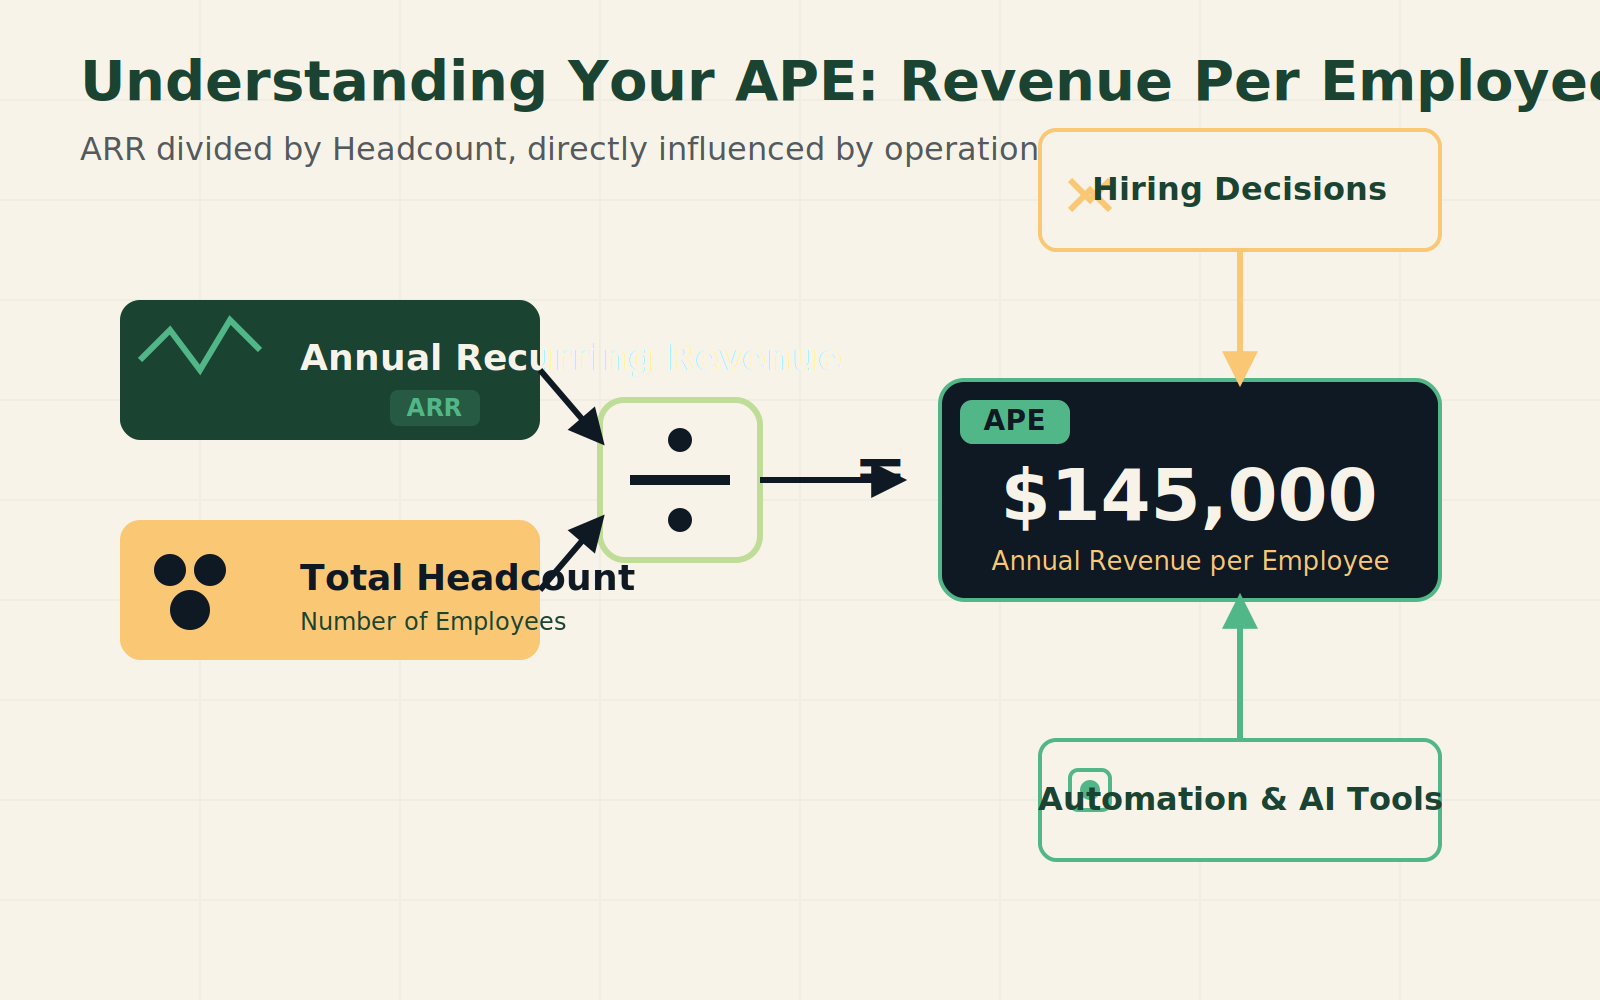
Every founder can tell you their revenue. Most can’t tell you how much value each employee generates. That gap is costing them. Revenue per employee – which VC firms have branded as APE (ARR Per Employee) – is the simplest efficiency metric that actually drives behavior. The calculation is straightforward: divide your annual recurring revenue by your total headcount. The result tells you, in cold numbers, how much output each person on your team is producing.
But the real power of APE lies in its operational tangibility. Unlike burn multiple or the Rule of 40 – abstract financial ratios that feel like shareholder concerns, not team actions – APE changes with every personnel decision. Hire a new salesperson? APE drops unless that hire brings in enough new ARR to offset their salary and burden. Automate a manual process? APE improves because you’re generating the same revenue with fewer people. It’s the one metric that turns efficiency from a boardroom aspiration into a daily operational lever.
The numbers back this up. People costs typically eat 70% of a cloud company’s expenses. So if you want to improve margins, you have to look at headcount. Breakeven APE – the revenue per employee needed to cover all expenses – has been climbing. A decade ago it hovered around $180,000. Today it’s closer to $250,000, and some companies have crossed $300,000. That means even if you hold headcount flat, inflation and rising compensation costs are quietly eroding your path to profitability.
Public cloud companies offer staggering benchmarks. Google’s APE sits around $1.7 million. Meta’s is $1.4 million. But those are outliers with massive scale and dominant market positions. More relevant for growth-stage companies: a Series B firm with $5 million ARR and 80 employees has an APE of $62,500. A Series D company with $50 million ARR and 300 employees clocks in at $167,000. The sweet spot many VC analysts point to is $200,000 for mid-to-late stage companies – still far from breakeven for most.
The Workflow Math
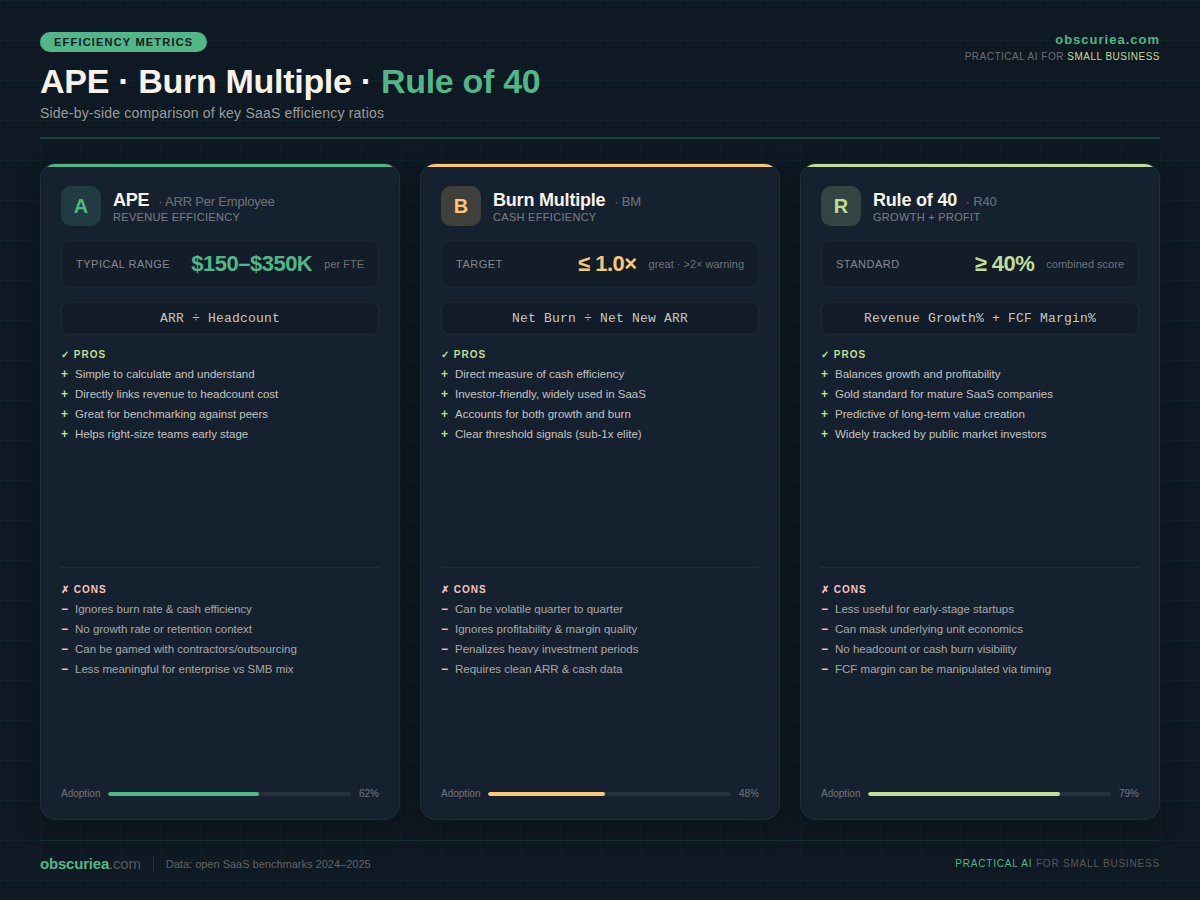
Comparing APE to other efficiency metrics shows where it wins and where it falls short. Burn multiple (net burn divided by net new ARR) tells you how cost-efficient your growth is, but it’s a rearview mirror number that mixes cash spending with revenue creation. It’s hard for a product manager or an engineer to know how their daily work affects it. APE, by contrast, is instantly transparent: add revenue without adding headcount, and the number goes up. Add headcount without proportional new revenue, and it goes down.
Consider a concrete scenario. A company with $10 million ARR and 50 employees has an APE of $200,000. If they want to grow ARR to $15 million, they have two paths. Option A: add 25 employees (bringing headcount to 75) – APE drops to $200,000, barely staying flat. Option B: add 10 employees and invest $200,000 in automation tools – APE rises to $250,000. The second path is harder in the short term but builds a more efficient engine. APE makes this tradeoff visible.
Here’s a quick reference table of APE targets by stage (based on Battery Ventures data and TechCrunch analysis):
| ARR Range | Typical Headcount | APE Benchmark | Target APE |
|---|---|---|---|
| $0–$2M | 10–20 | $50k–$100k | $100k |
| $2M–$10M | 20–80 | $63k–$125k | $150k |
| $10M–$50M | 80–300 | $125k–$167k | $200k |
| $50M+ | 300+ | $167k–$300k | $300k+ |
These are rough guidelines – geography, gross margin, and capital efficiency all shift the target. But they give operators a starting point for honest self-assessment. You can read more about the original APE framework in this TechCrunch article. For a deeper look at how other North Star metrics have succeeded and failed, see [ProductPlan](https://www.productplan.com)’s analysis.
Where It Breaks
APE is a powerful tool, but it’s not a silver bullet. It breaks in predictable ways that operators need to watch for.
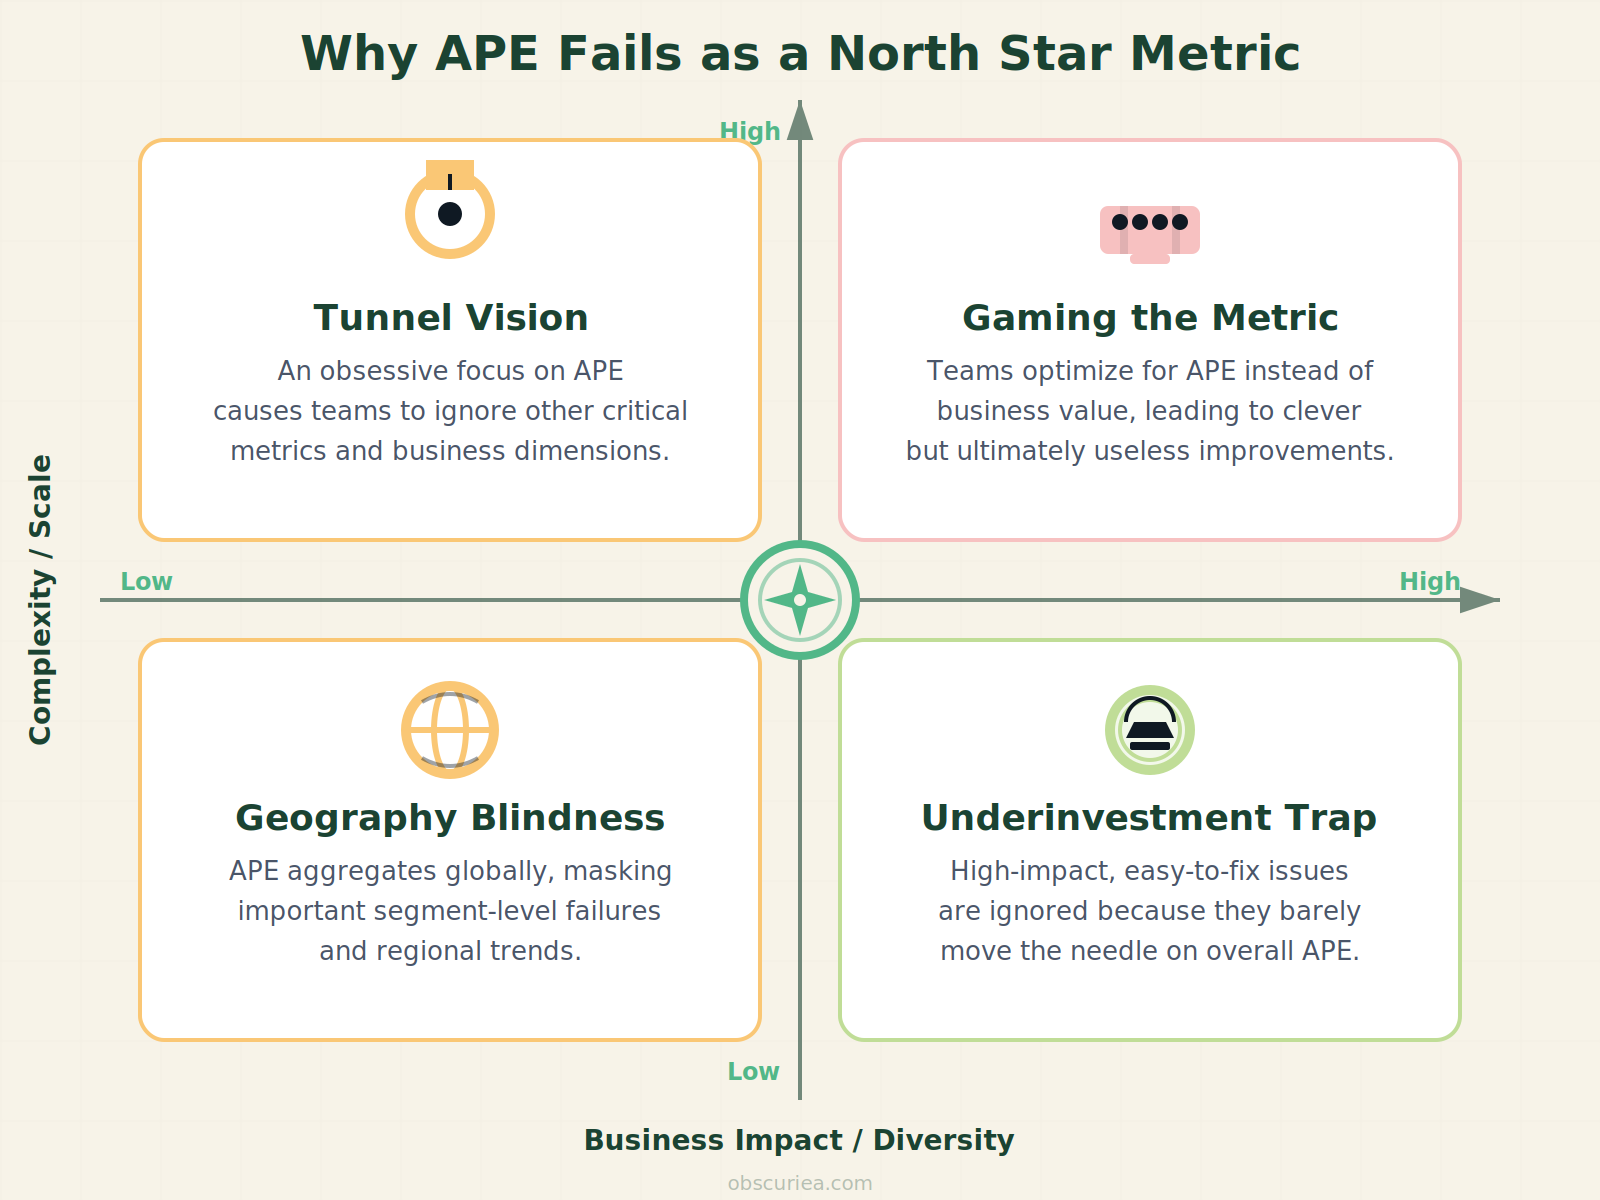
Gaming the Metric: The moment you hang a team’s bonus on APE, you’ll see behavior that improves the number without improving the business. Hire interns instead of experienced staff. Move full-time roles to contractors (who don’t count as employees). Outsource customer support to a low-cost vendor. Each of these can inflate APE while degrading quality or creating hidden long-term costs.
Tunnel Vision: APE measures efficiency, not health. You can have a high APE and terrible customer retention, broken product experiences, and burnt-out teams. The metric doesn’t capture churn risk, product-market fit, or innovation velocity. Companies that optimize solely for APE often discover too late that they’ve squeezed so hard they’ve cracked the foundation.
Early-Stage Irrelevance: If you’re pre-revenue or below $1 million ARR, APE is virtually useless as a North Star. A seed-stage startup might have an APE of $10,000 – that doesn’t mean it’s failing; it means it’s investing in product development with no revenue yet. Pushing for a high APE at that stage would kill the business.
Geography Blindness: The benchmarks above are built on US data. In Southeast Asia, labor costs are 40–70% lower for equivalent roles. But so are ARR averages – smaller markets, different pricing dynamics. A $63,000 APE for a Series B company in Jakarta might be strong, while the same number in San Francisco would be a warning signal. Operators running SEA businesses need their own reference set, not borrowed US numbers.
Underinvestment Trap: The easiest way to boost APE is to stop hiring. But that starves growth. If every department head is told to improve APE, they’ll freeze headcount requests – even for roles that would generate 5x their salary in new revenue. You end up with an efficient, stagnant company. The goal isn’t the highest possible APE; it’s the APE that balances efficiency with the investment needed to win your market.
The Friction Box
- APE treats all revenue as equal – high-churn ARR looks the same as sticky, long-term ARR on a per-employee basis
- Breakeven APE calculations often exclude stock-based compensation, masking the true cost of equity-heavy compensation packages
- The metric doesn’t account for automation ROI – two teams with the same APE but vastly different technology stacks have very different efficiency profiles
- Seasonal businesses or project-based models (e.g., agencies) get misleading readings from a point-in-time headcount snapshot
- Employee morale suffers when APE is used as an individual performance proxy – it’s company-level, not role-level
Frequently Asked Questions About Revenue Per Employee as the New North Star Metric
What is APE in venture capital terms?
APE stands for ARR Per Employee, a metric that divides annual recurring revenue by total headcount. It was popularized by Battery Ventures as a way to track operational efficiency in cloud companies.
How is revenue per employee different from profit per employee?
Revenue per employee (APE) focuses on top-line efficiency – how much revenue each person helps generate. Profit per employee subtracts costs, giving a bottom-line view. APE is more commonly used as a leading indicator because revenue is less influenced by short-term cost optimizations.
Can revenue per employee be used outside of SaaS?
Yes, but with caution. In service businesses (consulting, agencies), revenue per employee is naturally lower (typically $100k–$150k at best) and less useful as a North Star. In product-based SaaS, the potential for high leverage makes APE more meaningful.
What is a good revenue per employee for a startup?
It depends on stage. For a Series B company, $60k–$100k is typical; for a Series D, $150k–$200k is a reasonable target. High-growth companies should aim to improve APE year-over-year while maintaining growth.
How can I improve my company’s revenue per employee?
The two levers are: (1) increase revenue without proportional headcount growth (via automation, higher pricing, or better sales efficiency), and (2) reduce headcount without sacrificing revenue (through attrition, not layoffs, and by avoiding unnecessary roles). The healthiest approach is the first.
What are the risks of focusing too much on APE?
Over-optimization can lead to underinvestment in growth, poor customer experience, and employee burnout. APE should be one of several metrics, alongside NPS, churn, and product engagement.
The Straight Talk
Revenue per employee is the best North Star metric for any SaaS company between $5M and $50M ARR that wants to build efficiency without resorting to layoffs. It forces hard tradeoffs into the open and gives every department head a clear, measurable objective.
Skip APE if you’re pre-revenue, if you’re in a land-grab market where market share matters more than margins right now, or if your business model has inherently low revenue per employee (consulting, services, agencies) – APE will just depress you.
Track your APE this quarter alongside churn and NPS. The number that scares you is the one that will save you.