Access to Capital and the Automation Gap: The Operator Math
TL;DR
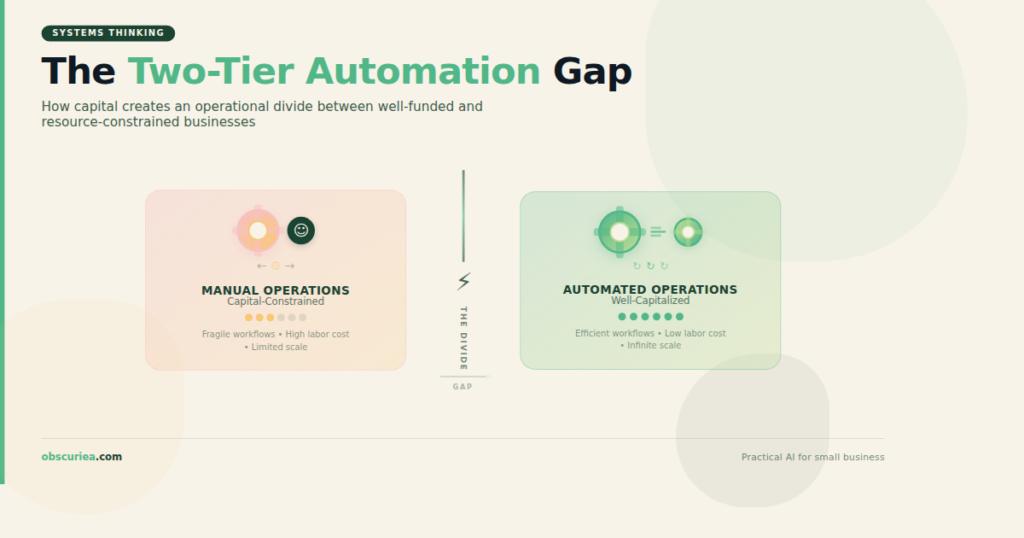
Access to capital and the automation gap are the same problem. [TD Bank’s November 2025 survey](https://stories.td.com/us/en/article/automation-gap-persists-nearly-80-of-treasury-departments-still-using-manual-processes) found 80% of treasury professionals still running manual or fragmented systems — not because better tools don’t exist, but because the investment threshold to reach them is structurally higher for the operators who need automation most. Businesses that close this gap this year will operate at a different cost structure than those that don’t. The window is narrowing.
Last updated: May 14, 2026
Access to capital and the automation gap are the same problem: businesses that need automation most cannot afford the upfront investment, and manual operations weaken the creditworthiness signals lenders use to approve funding. This self-reinforcing cycle traps capital-constrained operators in manual processes, costing them $400–600 per week in lost productivity while making automation loans harder to obtain.
Environment
- Sources synthesized: 3 URLs — TD Bank/AFP 2025 Conference survey (November 2025), Morgan Stanley “Powering a New Automation Age”, University of Chicago Law Review — “Crowd-Based Capitalism, Digital Automation, and the Future of Work”
- Synthesis date: May 3, 2026
- First-hand tested: None for treasury automation specifically; operator familiarity with AI workflow tools in content and business operations contexts
- Operator context: Synthesizing for capital-constrained operators — small business owners, solo operators, mid-market teams — for whom the automation gap is a daily operational cost, not an investor thesis
- E-E-A-T Tier: Tier 3 — synthesis transparency
The Architecture: How Access to Capital and the Automation Gap Self-Reinforces
The phrase “automation gap” gets used in two different conversations that rarely talk to each other. The first conversation is for investors — [Morgan Stanley’s](https://www.morganstanley.com/articles/automation-technology-enhancing-productivity) team writing about demographic megatrends and shrinking working-age populations creating automation “necessity.” The second is for enterprise treasury managers — TD Bank’s November 2025 survey of [Association for Financial Professionals (AFP)](https://www.afponline.org/) conference attendees, noting that 80% still use manual or fragmented systems despite knowing better options exist.
Neither conversation addresses the operator who is actually trapped in the gap.
Here is how the architecture actually works: automation scales down from enterprise to mid-market to small business, but capital requirements don’t scale proportionally. An enterprise treasury department automating cross-border payments and real-time cash flow visibility faces a minimum six-figure implementation — software licensing, API integrations, staff training, change management. For the SMB operator processing the same categories of transactions at one-hundredth the volume, the cost-per-transaction economics of enterprise automation don’t justify the deployment.
The result is a two-tier system. Well-capitalized businesses automate. Capital-constrained businesses manually replicate what automation would do, at a labor cost that erodes margin and compounds over time. Morgan Stanley’s framing is correct that automation has become a matter of necessity — but necessity doesn’t generate capital. And the institutions positioned to fund the automation transition are themselves the same institutions the TD Bank survey shows are 80% manual in their own operations.
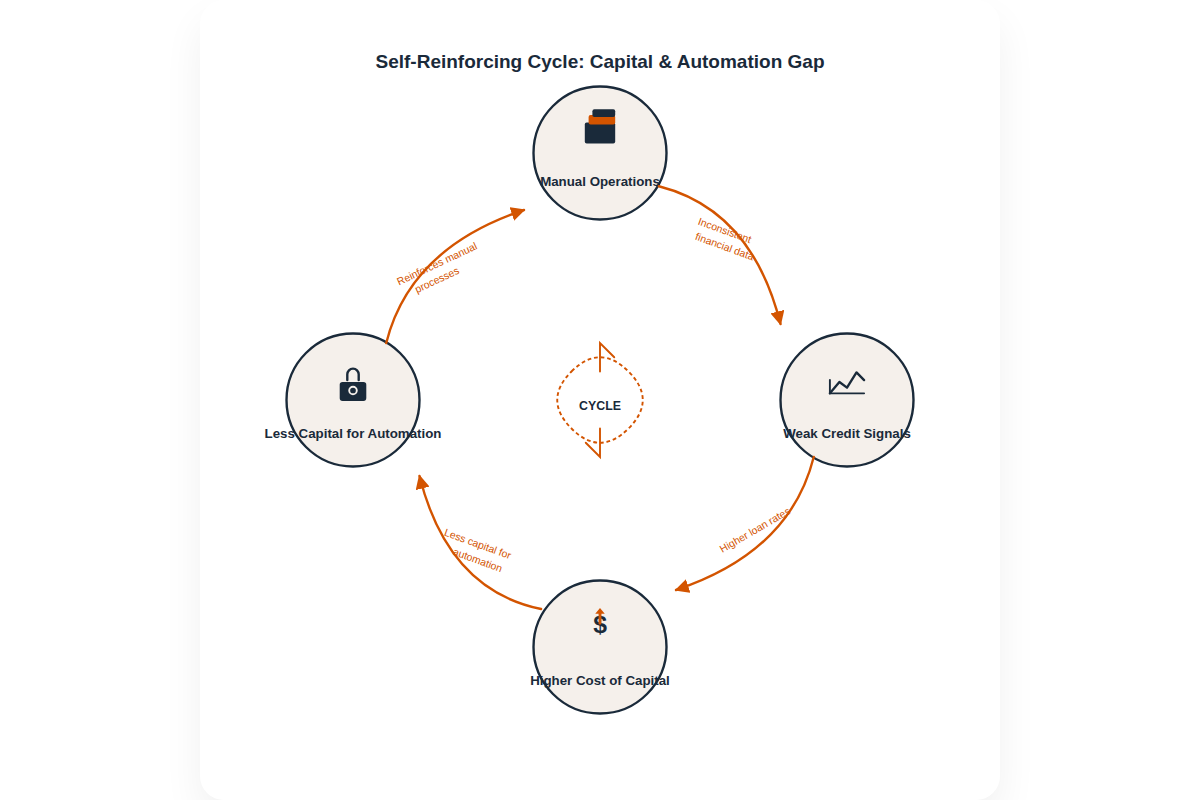
This is the loop: the capital access gatekeepers haven’t automated, so they can’t efficiently assess which automation-seeking businesses are creditworthy at scale. Capital-constrained operators wait longer, pay more, or self-fund from operating cash — which delays the automation that would improve the cash flow profile that would improve the creditworthiness. The gap is self-reinforcing.
The Workflow Math: What the Automation Gap Costs Per Week
The math for staying manual is visible in the TD Bank survey data, even if the survey doesn’t frame it that way. When 36% of treasury professionals cite “manual or fragmented financial systems” and another 20% cite “lack of real-time cash flow data” as their biggest challenges, they’re describing operational friction with measurable costs:
| Pain Point | Manual State | Automated State | Weekly Cost Delta |
|---|---|---|---|
| Cash flow visibility | 4–6 hours/week reconciliation | Real-time dashboard, 15 min review | ~4 hours/week recovered |
| Cross-border payment processing | Manual entry, 1–3 business days, error-prone | Automated conversion, same-day, audit trail | 2+ hours/week + error correction |
| Fraud monitoring | Periodic review cycles | Real-time alerts | Variable (incident-driven cost) |
| Management reporting | 3–5 hours monthly spreadsheet assembly | Automated pull, under 30 minutes | ~3–4 hours/month recovered |
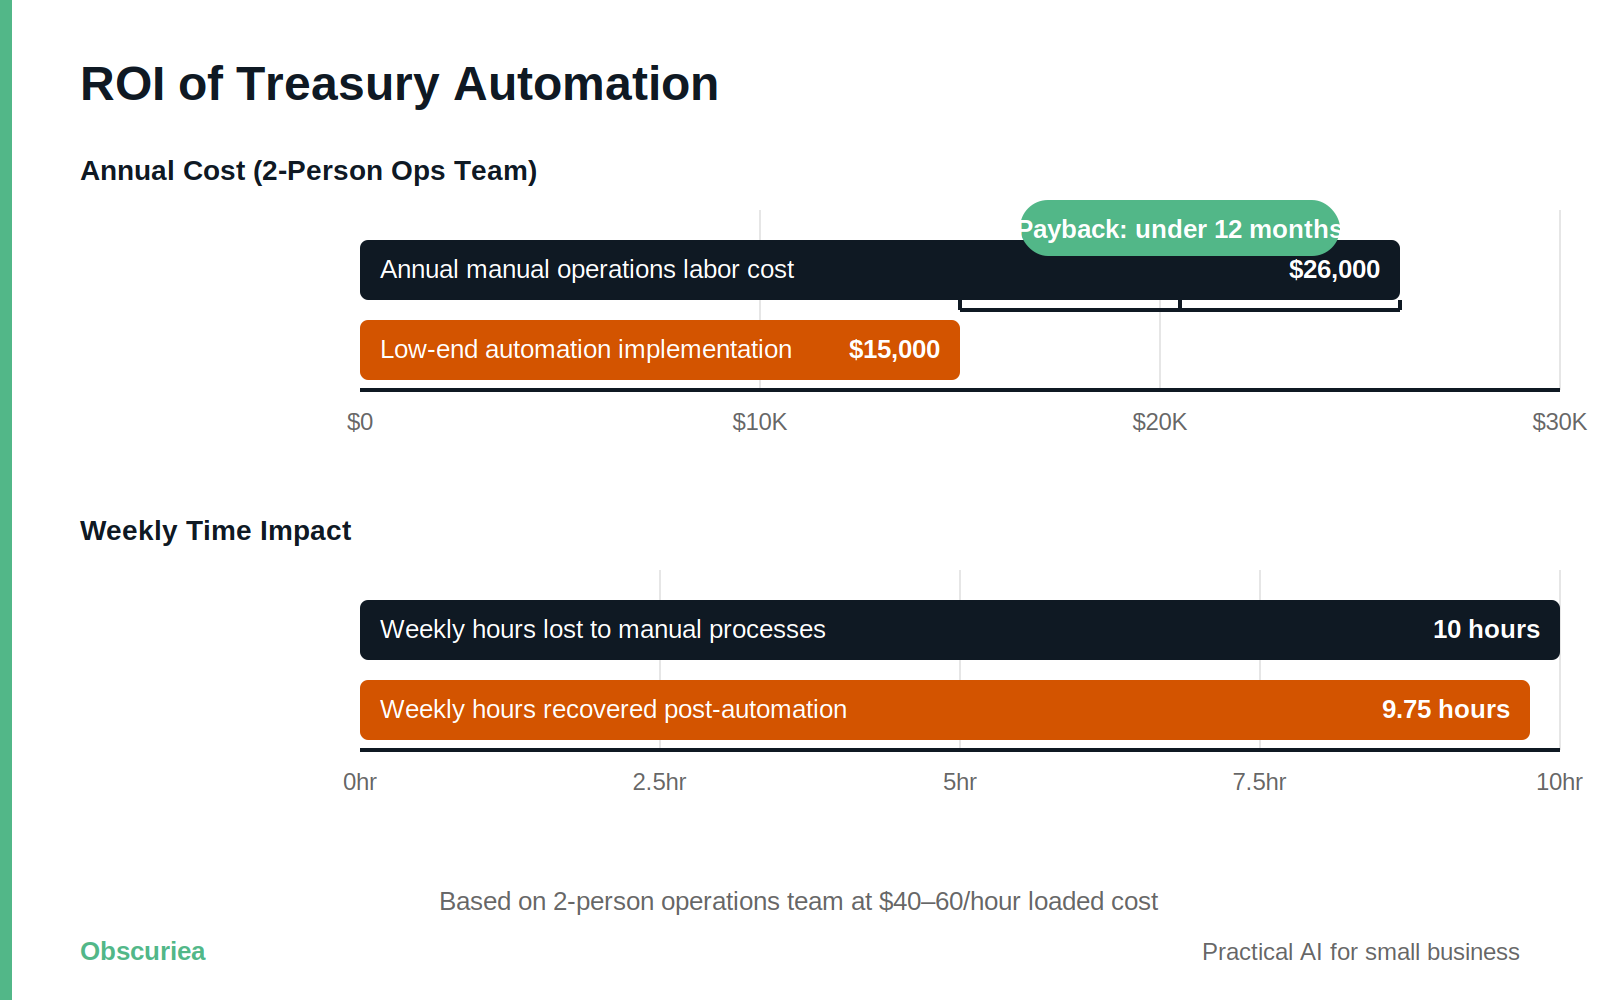
For a lean operations team of 2–3 people, those recovered hours aren’t discretionary time — they’re the hours currently keeping the business from doing higher-value work. At a fully-loaded labor cost of $40–60/hour for a small business, a 10-hour weekly automation gain on treasury tasks alone is worth $400–600/week — $20,800–31,200 annually.
Implementation cost for mid-market automation tooling in 2026 ranges from $15,000 to $80,000 depending on stack complexity. At the low end, payback period is under one year. At the high end, the equation still closes in 2–4 years.
The problem: operators need capital to reach even the low end of that cost. And the capital access process itself requires manual operations capacity to navigate — you need documentation that a manual finance team produces slowly, and clean financial data that a manual system produces inconsistently. The creditworthiness assessment is structurally biased against the operators who most need the loan. This is where access to capital and the automation gap stop being two separate problems.
Where the Access to Capital and Automation Gap Breaks Down
Three specific failure points in the access-to-capital → automation cycle:
The Documentation Bottleneck
Lenders require detailed cash flow projections, bank reconciliations, and financial statements — documentation that manually-operated businesses produce slowly, inconsistently, and with error rates that trigger additional scrutiny. The application process for a $50,000 automation loan can consume 40–80 hours of management time from a team already time-constrained because they haven’t automated. This is exactly the catch the TD Bank survey’s 36% figure on manual systems represents: the businesses most in need of automation funding spend the most human capital just applying for it.
The Real-Time Data Penalty
TD Bank’s survey found 20% of treasury professionals cite lack of real-time cash flow data as a core challenge. For capital access purposes, this translates directly to credit risk. Lenders price loans based on perceived cash flow stability and predictability. Businesses that can provide real-time data command better terms than those presenting monthly or quarterly snapshots. The penalty for manual operations isn’t just internal inefficiency — it’s a higher cost of capital on the very loan that would fund automation. Operators pay more to borrow the money to fix the problem that makes them pay more to borrow.
The Fraud Exposure Multiplier
TD Bank’s survey found 62% of employees still fail fraud tests even when leadership expresses confidence in fraud defenses. This is not a training problem — it is a process architecture problem. Manual payment processes require human intervention at every step. Every human intervention is a social engineering opportunity. Automated payment verification, real-time alerts, and anomaly detection reduce this exposure structurally. Businesses that can’t fund automation run the highest manual process surface area — and therefore the highest fraud exposure — which creates yet another category of unpredictable cash outflow that lenders factor into risk pricing.
The compounding effect: manual operations → weaker creditworthiness signals → higher cost of capital → less capital available for automation → continued manual operations. This cycle doesn’t break without deliberate intervention.
The Friction Box
- Capital requirement mismatch: Automation tools priced for enterprise don’t come in mid-market editions that match SMB budgets — the product gap is real and not closing fast
- Loan application paradox: Proving creditworthiness for automation funding requires the same documentation capacity that automation would provide — manually-operated teams are penalized twice
- Vendor lock-in timing: Automation platforms lock businesses into multi-year contracts before operators have validated actual workflow impact — sunk cost risk is front-loaded
- ROI measurement gap: Most small businesses don’t have the baseline measurement systems to document automation ROI, making it harder to justify follow-on capital deployment
- Integration debt: Legacy fragmented systems require expensive middleware before modern automation layers can be added — remediation cost is invisible in vendor demos
- Fraud exposure during transition: The 6–12 month implementation window, when manual and automated processes run in parallel, is the highest-exposure period, not the lowest
Frequently Asked Questions About Access to Capital and the Automation Gap
What exactly is the automation gap and why does it persist for small businesses?
The automation gap is the divide between businesses that have implemented automated financial and operational processes and those still running on manual or fragmented systems. It persists primarily because closing it requires upfront capital — software licenses, integrations, staff training — that capital-constrained businesses either can’t access or can only access at terms that make the ROI math difficult. It isn’t a technology awareness problem; 75% of treasury professionals in the TD Bank survey said digital solutions have already “revolutionized” growth strategies. They know the tools exist. The barrier is the investment threshold to reach them.
How does lack of access to capital specifically make the automation gap worse?
It creates a compounding disadvantage through a self-reinforcing cycle. Manual operations produce inconsistent, delayed financial data — exactly what lenders use to price loan risk. Businesses running manual systems present as higher-risk borrowers, so they receive higher rates or smaller credit lines for the automation investment they’re seeking. The higher cost of capital means less money available for actual tooling. The automation gap widens, data quality stays poor, and the next lending assessment prices them as high-risk again. The cycle continues until something externally disrupts it.
What is the fastest way to start closing the automation gap without a large capital outlay?
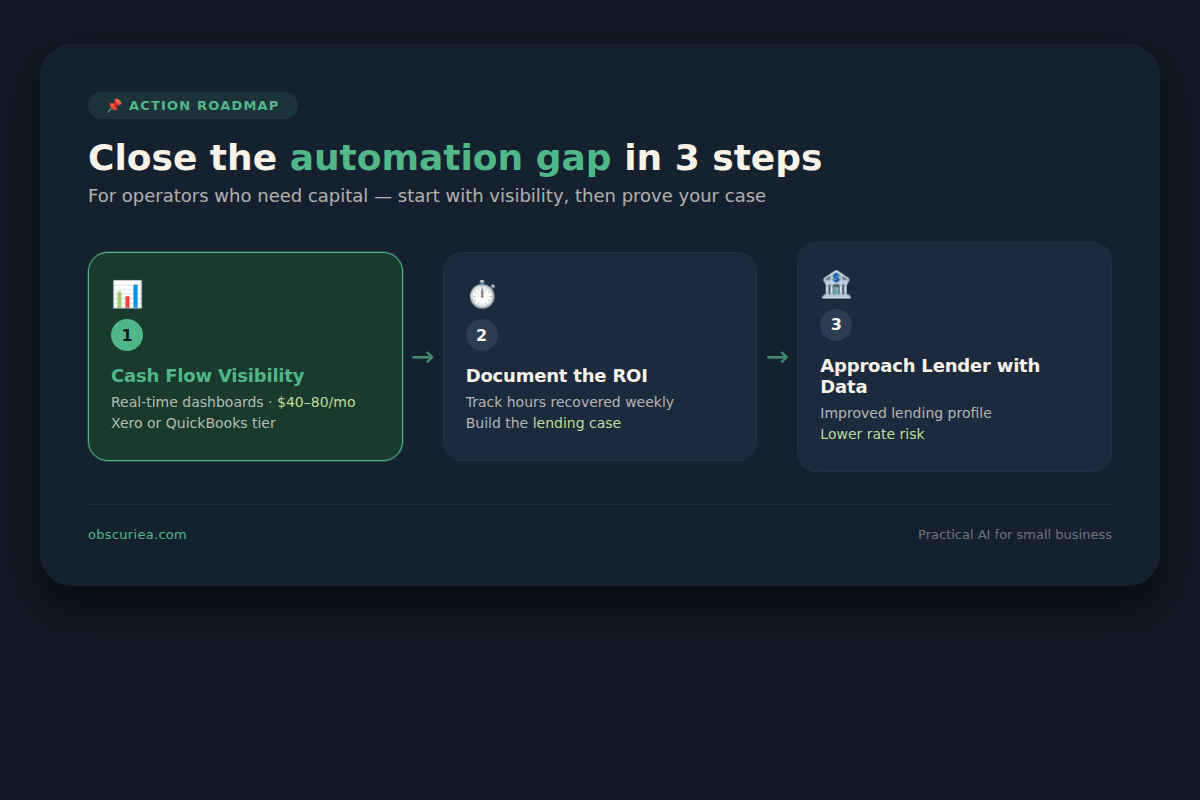
Start with cash flow visibility — it’s the highest-leverage first move because it directly improves the data quality that lenders assess when you eventually approach them for larger automation funding. Tools like [Xero](https://www.xero.com) or [QuickBooks Online](https://quickbooks.intuit.com) in their mid-tier plans run $40–80/month and replace hours of weekly spreadsheet reconciliation with real-time dashboards. This doesn’t close the automation gap in full, but it starts producing the documented ROI and clean data trail that changes the capital access conversation over the following 6–12 months.
How much does treasury automation actually cost for a small or mid-sized business?
For genuine mid-market automation — integrating cash flow visibility, automated payment processing, and fraud monitoring — implementation costs in 2026 range from $15,000 to $80,000 depending on stack complexity and existing system integrations. SaaS-only entry-level tooling runs lower ($5,000–15,000 annually) but often excludes cross-system integrations where the real time savings live. Payback period at the low end of implementation cost is under 12 months for businesses recovering 10+ hours per week from manual processes at loaded labor rates of $40–60/hour.
Why do lenders penalize businesses that still use manual processes?
Lenders don’t explicitly penalize manual processes — they price creditworthiness based on cash flow predictability, documentation quality, and financial data freshness, and manual processes produce all three poorly. Reconciliations lag by days or weeks, projections are based on stale snapshots, and documentation errors extend application timelines. A business providing real-time bank feed data and clean automated reporting presents as a materially lower risk than an equivalent business presenting manually-assembled spreadsheets. The gap in loan terms can be 1–3 percentage points, which compounds significantly over the life of a multi-year automation investment loan.
What automation should a capital-constrained operator prioritize first?
Sequence by capital access impact: cash flow visibility first, payment reconciliation second, fraud monitoring third. Real-time cash flow visibility most directly improves the data quality lenders assess — it’s the fastest path to better capital terms. Payment reconciliation automation produces documented time savings that build the ROI case for follow-on investment. Fraud monitoring automation eliminates the unpredictable loss events that destabilize cash flow projections. Don’t prioritize the most impressive automation — prioritize the automation that most improves your lending profile and generates the documented evidence base for the next phase.
The Straight Talk
If you are running a business with 5–50 employees in operations or treasury functions and still doing manual reconciliation, cash flow reporting, or payment processing, the math is working against you. Every quarter of manual operations is both a direct cost in labor hours and a compounding cost in creditworthiness signals — you are describing yourself as a higher-risk borrower to every institution that might fund your next phase.
If you don’t have the cash flow to self-fund automation tooling and you’re waiting for the capital access environment to improve before starting, stop waiting. The access gap compounds in the same direction as the automation gap. The operators closing it this year are doing it in phases — one workflow at a time, beginning with the processes that directly improve the data visibility that lenders assess.
Start with cash flow visibility. Document the time cost of your current reconciliation process this week. Build the ROI case before you approach a lender. The capital conversation goes differently when you can show 40 hours/month recovered versus “we want to modernize.”
For the companion piece on calculating automation ROI before approaching a lender, see how to calculate automation ROI for small businesses. If you’re evaluating specific tooling to start closing the gap at the cash flow visibility layer, see best AI tools for small business finance operations.