
TL;DR: Smart salary benchmarking doesn’t require a $35,000 tool. For most SMBs, a combination of free government data and one affordable SaaS tool provides 80% of the value. The math is clear: you need current, location-adjusted data—but most operators are overpaying for data they don’t use or relying on outdated surveys that hurt offers and invite turnover.
Environment:
– Sources synthesized: 3 URLs (Workleap, Visier, Pin.com)
– Synthesis date: 2026-02-14
– First-hand tested: Pave free tier, Levels.fyi, BLS Occupation Statistics, and manual Excel benchmarking for remote teams across Southeast Asia
– Operator context: SMB operations managing compensation across multi-country remote teams, with direct experience in APAC market data gaps
The Architecture
Most operators can’t tell you the exact market rate for a role they’re hiring for today. That’s not a failure of effort—it’s a failure of data systems. Here’s how to fix it.
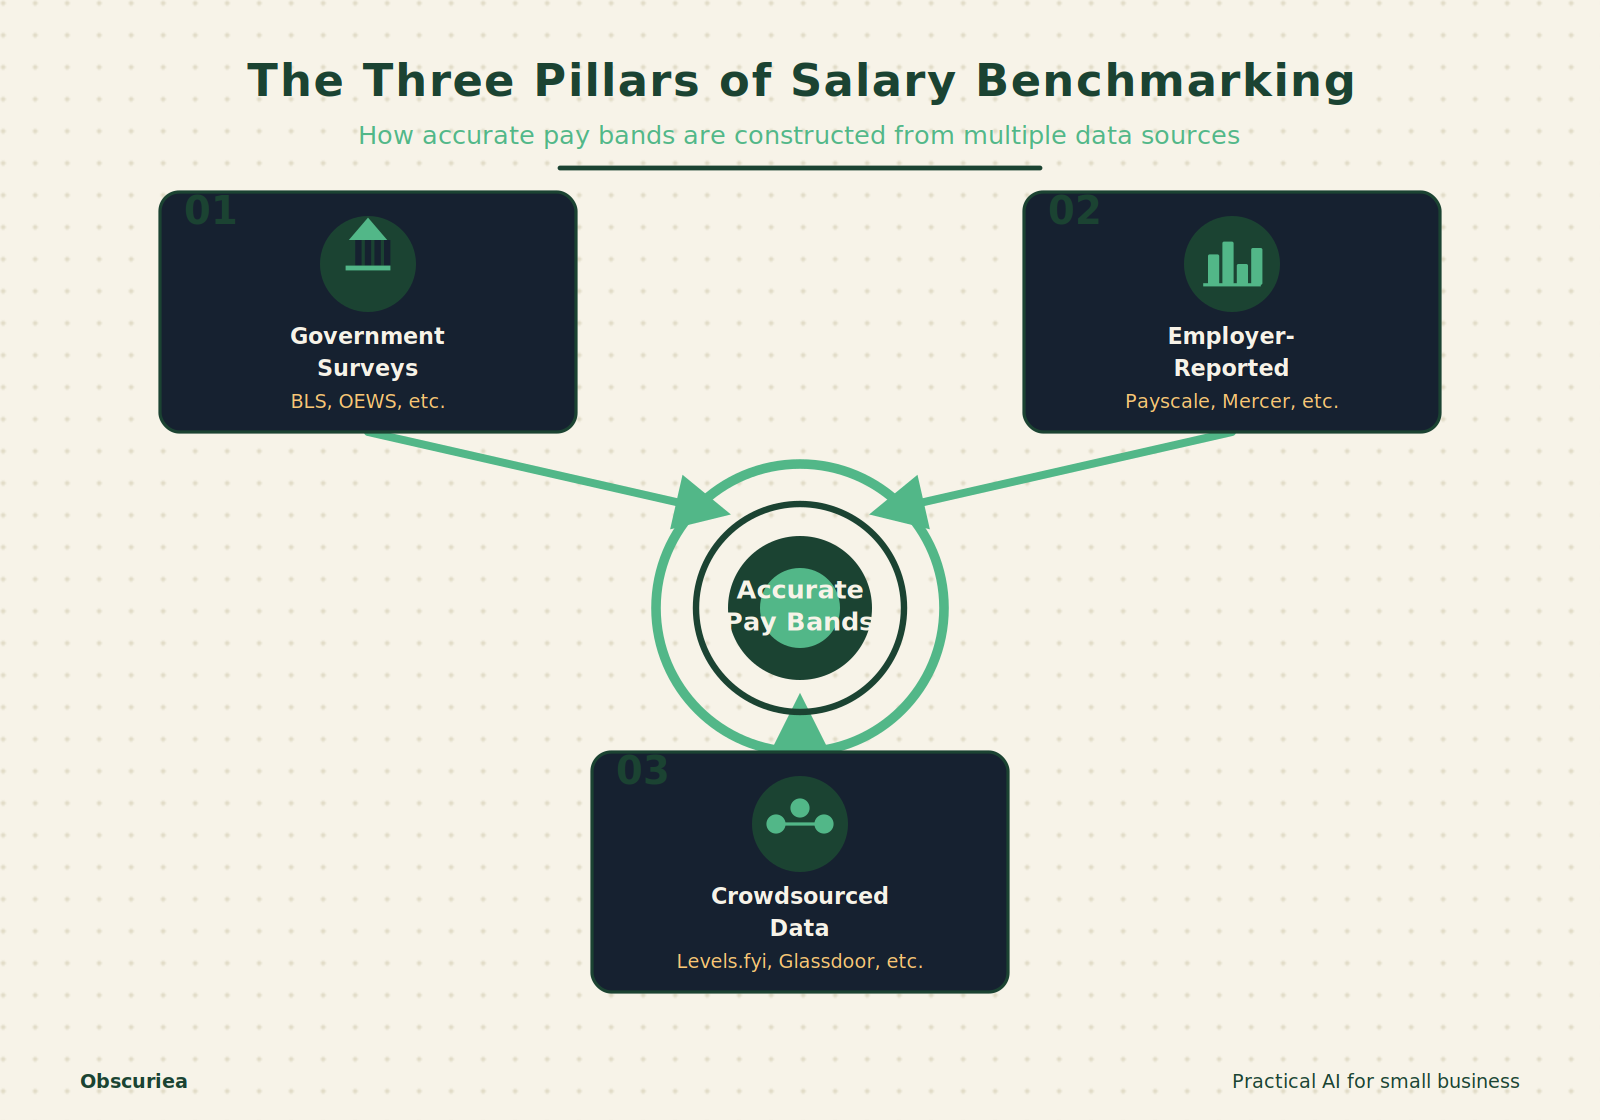
Salary benchmarking works by matching your internal job roles to external market data. The data comes from three main sources: government surveys (like the BLS Occupational Employment Statistics), employer-reported surveys (Mercer, Payscale, Salary.com), and crowdsourced employee data (Levels.fyi, Glassdoor). A few tools—Pave, Ravio, Comprehensive.io—pull live payroll data directly from company HR systems, refreshing weekly or even daily.
The process is straightforward: you map your job titles to standard occupation codes, apply location and industry adjustments, then set a salary range—usually the 25th, 50th, and 75th percentiles—for each role. The tool then compares your existing pay against those benchmarks. Paid platforms automate the mapping and provide visual dashboards. Free options require you to do the matching manually.
But here’s the catch that most vendor articles skip: the data quality varies dramatically by region and role. In the US, BLS covers over 800 occupations across 650 locations, updated annually. For a mid-market SaaS company in Texas, that’s useful. For a 20-person e-commerce operation in Jakarta? The BLS won’t help. Your benchmark is either a tool with international coverage (Pave covers 55+ countries, though often thin outside US/EU) or you piece together local salary surveys and job postings.
The Workflow Math
The decision between DIY and a tool comes down to your weekly time cost and data accuracy needs.
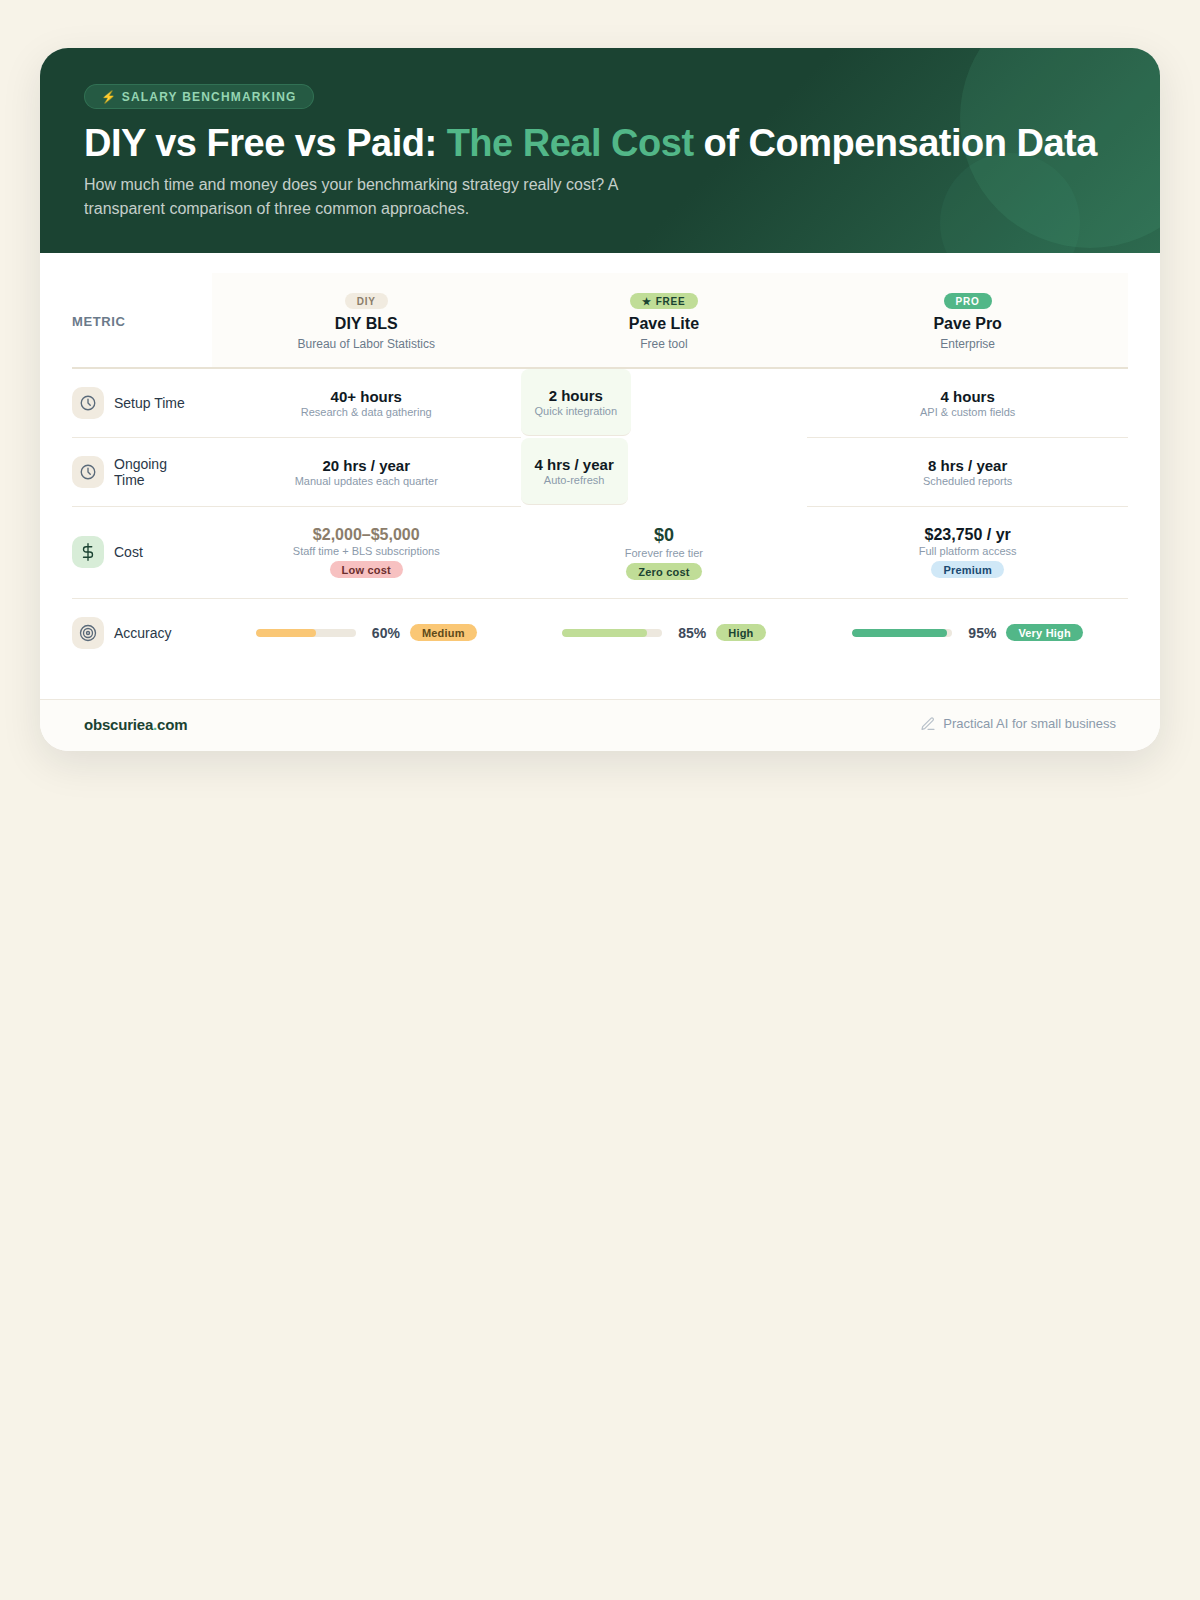
A manual approach: extract BLS data, map 10 roles, apply a cost-of-living multiplier, and create bands. That’s 4–6 hours the first time, then 2 hours per quarter to refresh. Total: about 10 hours a year. Cost: $0. Accuracy: okay for common roles, lags 12–18 months, no equity data.
A free-tier tool (Pave Market Data Lite for companies under 200 employees): connect HRIS or manually enter data, get 200 job families, US and one international market. Setup: 1–2 hours. Ongoing: 30 minutes per month to review market changes. Cost: $0. Accuracy: real-time for connected data, still US-heavy.
A paid tool (Pave Market Data Pro, about $23,750/yr for 250 employees): adds international benchmarks, advanced reports, equity data, and AI job matching. Setup: 3–5 hours with HRIS integration. Ongoing: 15 minutes per month for reviews. Total annual cost: $23,750. Accuracy: best in class for tech and growth companies.
| Method | Setup Time | Ongoing Time/Year | Cost/Year | Accuracy Level | Best For |
|---|---|---|---|---|---|
| DIY BLS | 4–6 hrs | 2 hrs/quarter (~8 hrs) | $0 | Medium – common roles only, 12–18 mo lag | SMBs with simple, stable roles |
| Free Tool (Pave Lite) | 1–2 hrs | 6 hrs | $0 | High – tech & US roles | Startups <200 employees |
| Paid Tool (Pave Pro) | 3–5 hrs | 3 hrs | $23,750 | Very high – equity, intl, real-time | Scaling tech companies 200+ employees |
For most SMBs without venture capital, the free tier or a $30/month subscription to something like Levels.fyi produces adequate data. The paid tools pay for themselves only after you’ve got a full HR team and are making 20+ offers a month.
Where It Breaks
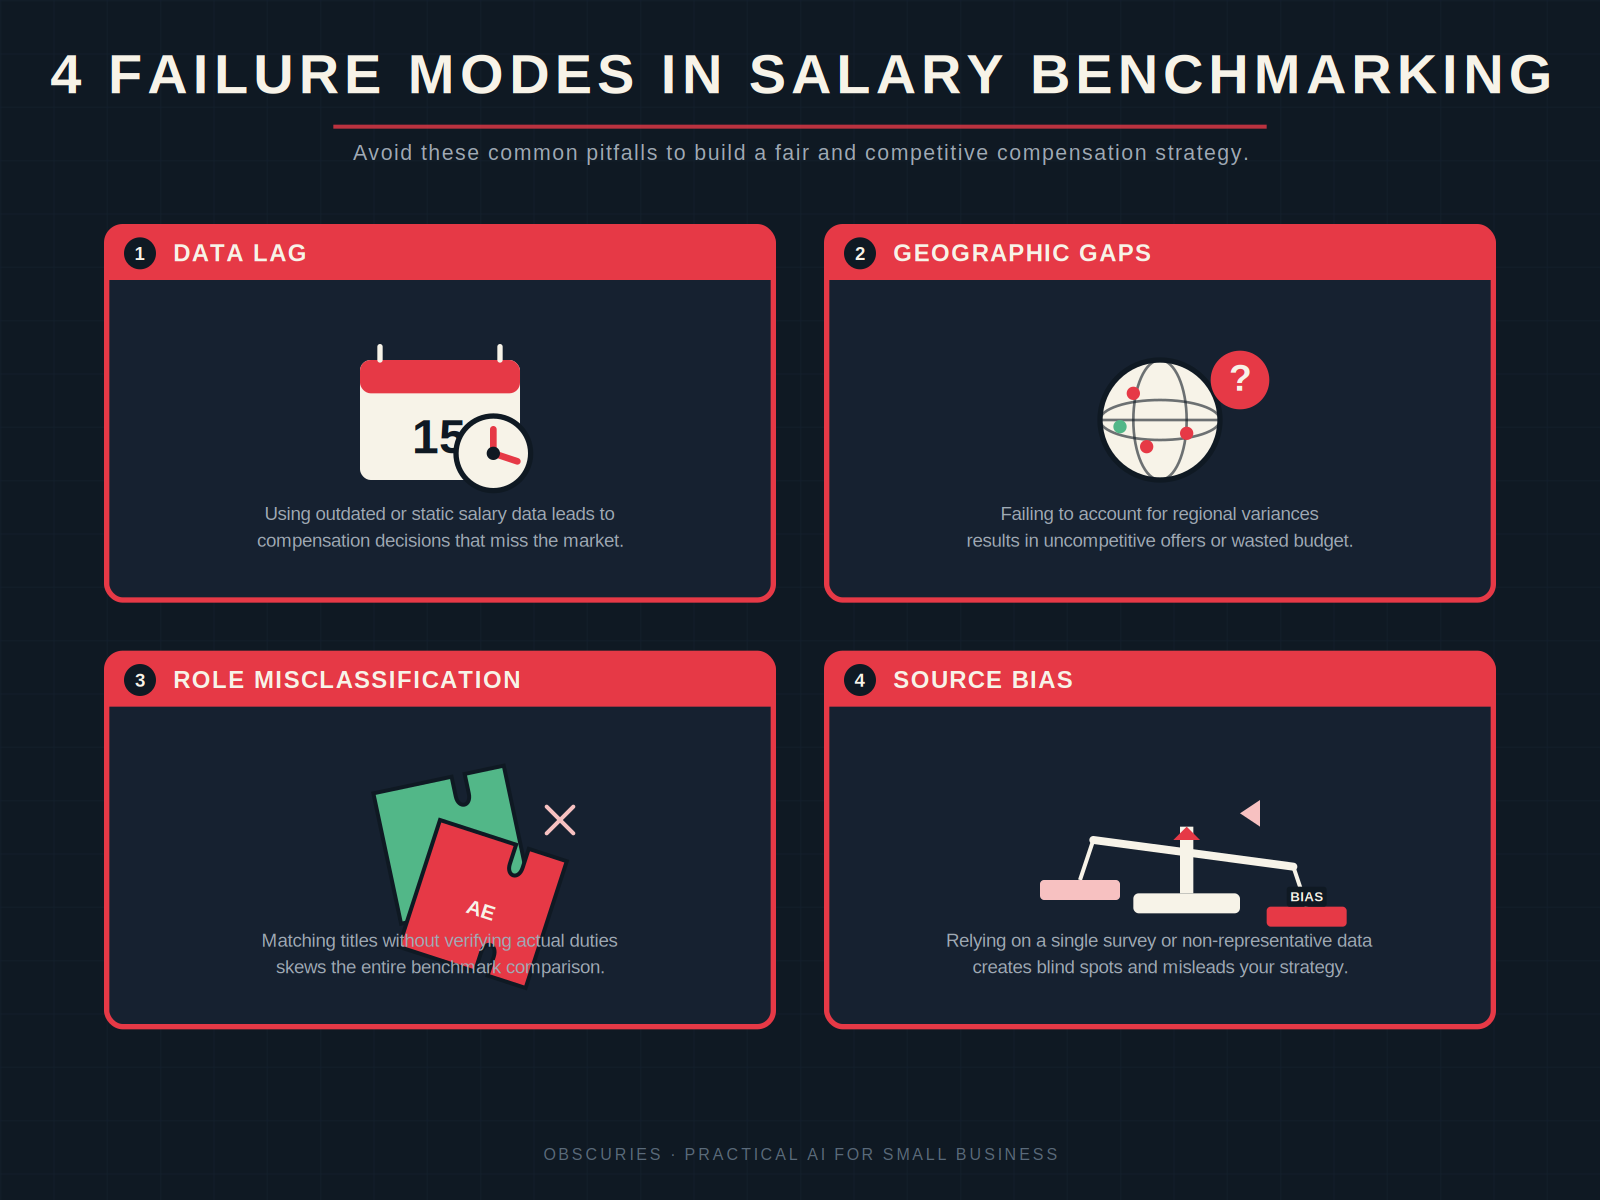
Three failure modes kill the value of salary benchmarking for operators:
1. Data fresh enough to use, but not fresh enough to trust for hot roles. A role like “AI Prompt Engineer” didn’t exist in BLS’s last update. By the time a survey captures it, the market has moved 20%. Crowdsourced data fills gaps but introduces noise—one inflated self-report skews the median.
2. Geographic gaps that invalidate the benchmark. Most free tools offer limited international coverage. If you’re hiring a developer in Bangkok but your benchmark is based on US data plus a generic multiplier, you’re off by 10–30%. Local salary surveys are hard to find and often expensive.
3. Role matching is deceptively hard. A “Project Manager” in a construction firm is a different job from a software PM. Tools that auto-map to standard occupations often assign the wrong code, giving you useless data. Manual verification adds back the time you thought you saved.
4. Over-reliance on one source. Operators who use only one tool miss the bias in that dataset. Crowdsourced sites underreport low salaries. HR-reported surveys overweight larger companies. Free government data misses equity and bonuses. The fix: cross-reference at least two data sources.
The Friction Box
- Survey data lags 12–18 months, making it dangerous for roles in rapid wage inflation (tech, healthcare).
- Free tiers are US-centric—useless for global or APAC teams unless you subscribe to paid plans.
- AI job matching still misclassifies 1 in 5 roles, even in the best tools.
- Manual data entry for HRIS-connected tools still fails every quarter during contract renewals.
- Equity data is opaque and often based on stale valuations for private companies.
- Pay transparency compliance adds a liability layer—if you use wrong data and underpay, you’re exposed legally.
Frequently Asked Questions About Smart Salary Benchmarking
How often should I update salary benchmarks?
At least quarterly for fast-moving roles (tech, specialized engineering, AI workers). For stable roles like administrative support, annually is sufficient. The key is to check the update frequency of your chosen data source and not rely on stale data for hiring decisions.
What’s the best free salary benchmarking tool?
Pave’s Market Data Lite and Comprehensive.io offer the most useful free tiers for tech-focused companies under 200 employees. The Bureau of Labor Statistics is the best free government source for US-based roles in traditional industries. For global teams, Levels.fyi’s free tier covers 40+ countries but relies on user-submitted data.
Can I use salary benchmarking without a dedicated HR team?
Yes. Start with BLS data for your primary location and use a free tool like Pave Lite to cross-check. Spend 30 minutes per quarter updating your bands. As you scale and make more offers, consider a paid tool when the time saved exceeds the subscription cost.
How do I handle salary benchmarking for remote workers in different countries?
Use tools that offer geographic differentials, like Pave (55+ countries) or Payscale (with location factors). Be aware that local currency, tax structures, and cost of living require separate adjustments—many tools handle only the first. For APAC countries, supplement with local salary surveys from associations like HROA or Mercer.
What’s the biggest mistake small businesses make with salary benchmarks?
Using a single, outdated source. Many SMBs take a number from Glassdoor or a friend in the same industry and call it a benchmark. That’s a recipe for either overpaying or losing candidates. The right approach is to use two independent sources and build a range, not a single number.
Do salary benchmarking tools work for non-tech roles?
Some do, but best for common roles (accounting, sales, marketing). For niche industries like hospitality or manufacturing, government data (BLS OES) or industry-specific surveys (SHRM, ERI) are better bets. General-purpose tools are weakest for specialized blue-collar or healthcare positions.
The Straight Talk
This approach is for SMB operators who want to stop guessing on offer letters and reduce turnover without a dedicated comp analyst. If you’re running a company with 5–50 employees and hire 1–2 people a month, start with BLS + one free tier tool and spend 30 minutes quarterly cross-checking. Skip the enterprise tools until you’ve got 100+ employees or your offer rejection rate is above 30%. The next concrete action: identify your most frequent hire role, pull BLS data and one free tool’s number, and see how far apart they are. That gap tells you exactly what you need.
For more on optimizing your hiring process, check out our guides on building a competitive compensation strategy and salary negotiation tactics for SMBs. If you’re using AI recruiting tools, learn how to evaluate market rates for specialized roles.