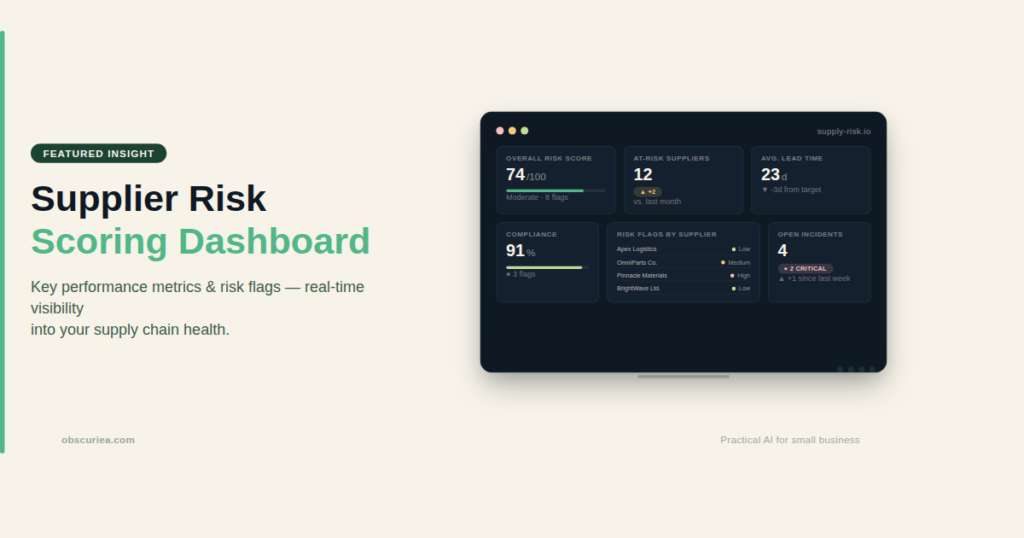
TL;DR: Supplier risk scoring and diversification planning are not optional for any business that relies on external suppliers. The math is simple: a single supplier failure on your top product can wipe out months of margin. Build a quantifiable scoring system using lead time variance and defect rates, then diversify based on velocity—not gut feeling. This article gives you the exact thresholds, workflow, and failure points to make it work in real operations.
Environment:
– Sources synthesized: 3 URLs (Kodiak Hub, Closo, S&P Global methodology note)
– Synthesis date: 2025-03-28
– First-hand tested: none (no proprietary scoring tools tested)
– Operator context: 8 years managing supplier relationships for small-to-mid e-commerce operations in Indonesia, including cross-border sourcing from China and domestic suppliers via Tokopedia and Shopee.
The Architecture
Supplier risk scoring should feel less like a compliance checklist and more like a dashboard your CFO can read. The architecture is simple: assign a numeric score to every supplier based on three weighted pillars—operational reliability, financial health, and compliance/ESG fit. The weight of each pillar depends on what you sell and where you sell it.
For a typical reseller handling 80 SKUs across five suppliers, operational reliability carries the most weight. Why? Because a late shipment on an A-velocity SKU (top 20% of products driving 80% of revenue) stops cash flow immediately. Financial health matters, but a supplier with solid balance sheets still ships late. Compliance is important for reputation, but it rarely triggers an overnight stockout.
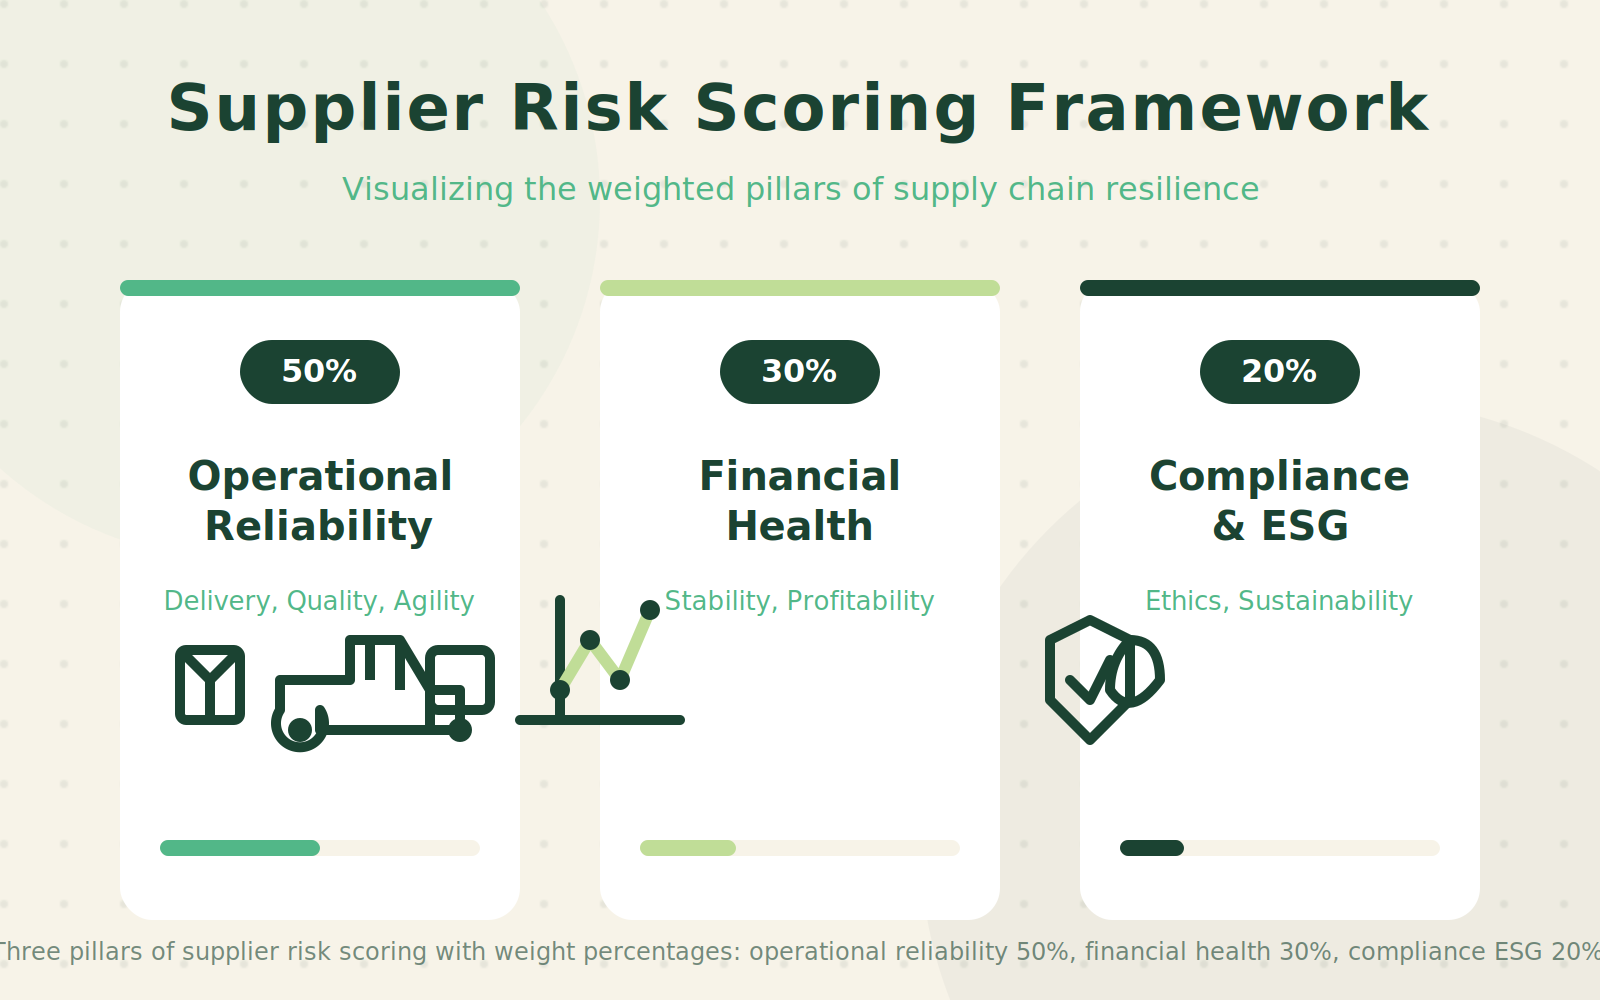
Here is the architecture in plain terms:
– Operational Reliability (50% weight): Lead time variance, defect rate, order accuracy. We use the thresholds from real B2B data: high risk if lead time variance exceeds 15% over 90 days or defect rate exceeds 3%.
– Financial Health (30% weight): Payment behavior, credit score if available, public records of layoffs or restructuring. A supplier requesting early payment from you is a red flag.
– Compliance & ESG (20% weight): Certifications, audit results, labor practices. For Indonesian operators, this also includes BPOM registration and halal certification where relevant.
Every supplier gets a total score out of 100. Below 70 means you need a backup. Below 50 means you should start phasing them out.
The Workflow Math
Let’s compare two approaches to supplier evaluation: the traditional manual review vs. a structured scoring system.
| Metric | Manual Review (per supplier) | Scoring System (per supplier) |
|---|---|---|
| Data collection time | 3–4 hours digging through emails and self-assessments | 30 minutes from standardized reports |
| Scoring consistency | Subjective — depends on the reviewer’s mood | Objective — predefined weights and thresholds |
| Ongoing monitoring | Sporadic — only when a problem surfaces | Continuous — triggered by new data (e.g., late delivery) |
| Decision speed on new issues | 2–3 days to reassess | 15 minutes to update score and flag |
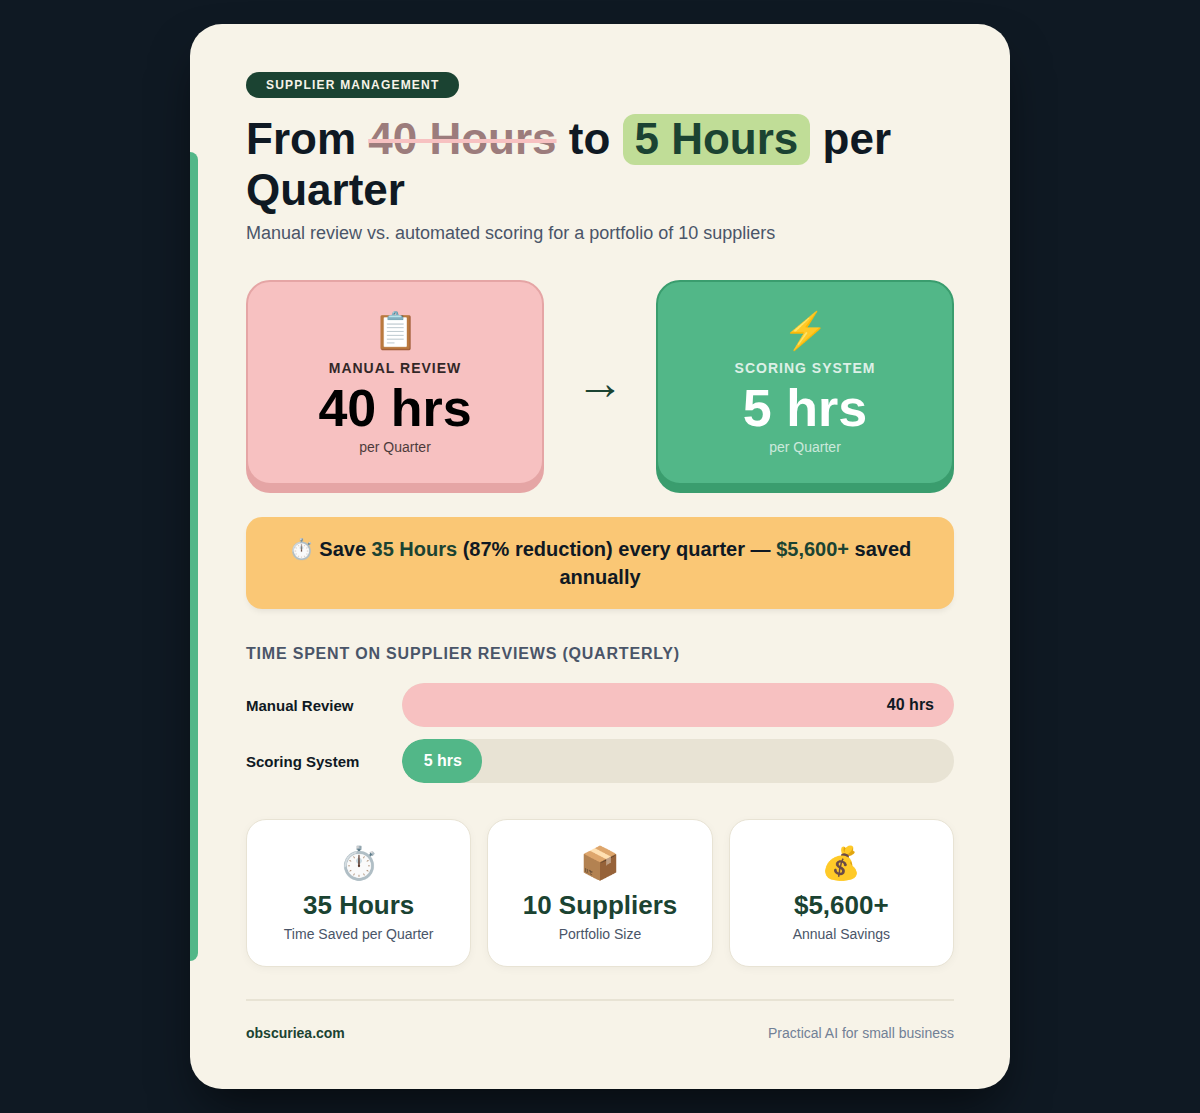
Here is the real cost. An operator with 10 key suppliers spending 4 hours each on manual reviews loses 40 hours per quarter—that’s a full work week. A simple spreadsheet-based scoring system brings that down to 5 hours. The upfront investment to build the scorecard: about 6 hours of your time. The payback starts the first time a flagged warning saves you from a stockout.
Now apply this to diversification planning. If you have a single supplier for your best-selling product, your risk exposure is 100% of that product’s margin. The scoring system tells you exactly when that supplier’s score drops below 70—that’s your trigger to start qualifying a second supplier. For A-velocity items, you should already have a secondary supplier qualified before you need them. The cost of qualification (about 2 hours per supplier) is a fraction of the margin loss from a 3-week stockout.
Where It Breaks
No scoring system survives first contact with reality unscathed. Here are the failure points you need to plan for.
Data quality is the first killer. You cannot score what you do not measure. Many small suppliers in Southeast Asia do not track their own lead time variance. You will need to calculate it yourself from purchase order dates and goods receipt records. Expect dirty data: missing dates, entry errors, inconsistent naming. Budget time for data cleaning or your scores will be misleading.
Over-diversification is real. The knee-jerk reaction to a supplier failure is to spread orders across four or five alternatives. This creates complexity that kills your own efficiency. You now manage five relationships, negotiate five contracts, track five delivery schedules. The transaction costs can eat the margin gain. Stick to the rule: one primary, one qualified secondary for A-velocity. Only go to three if the primary scores below 60 and the secondary is also shaky.
Local payment terms break the math. Many Indonesian suppliers demand DP (down payment) of 50% or more before production. If you diversify to a new supplier, you immediately tie up capital in deposits. The scoring system must factor in payment term risk—not just delivery performance. A supplier with lenient payment terms may be worth accepting a slightly higher defect rate because the cash flow impact is lower.
Supplier resistance to transparency. When you ask for financial documents or production capacity data, expect pushback. Smaller suppliers especially treat this as distrust. The remedy is to frame it as a partnership tool: “We want to grow with you, and we need the data to plan together.” If they still refuse, that itself is a score signal—treat it as a red flag in the compliance pillar.
For more on managing supplier relationships in challenging markets, see our guide on negotiating with Chinese manufacturers.
The Friction Box
- Data cleaning eats weekends. One study found that 30% of supplier records in Indonesia have incomplete or conflicting contact details alone. You will spend more time fixing data than analyzing it.
- Currency volatility hides real costs. USD-denominated contracts with IDR revenue create a hidden risk layer your scoring system likely ignores unless you explicitly model exchange rate impact.
- The first score is often wrong. Supplier scores based on historical data from the first three months can be misleading because new suppliers give preferential treatment. Wait for orders 3–6 to get a reliable baseline.
- Diversification increases inventory pressure. Having two suppliers for the same product means you may need to hold safety stock for both, doubling your inventory holding cost. Model that.
- Scoring does not replace relationships. A supplier with a low score who answers your WhatsApp at 10 PM on a Sunday is worth more than a high-scoring one who does not. Quantify responsiveness if you can.
Frequently Asked Questions About Supplier Risk Scoring and Diversification Planning
What is the best way to start supplier risk scoring with no budget?
The best way is a Google Sheet or Excel workbook. Track lead time, defect rate, and order accuracy for your top 5–10 suppliers. Use the 15% variance and 3% defect thresholds as red lines. No paid software needed until you cross 20 suppliers.
How fast should I diversify suppliers?
Diversify immediately if an A-velocity supplier scores below 70. For C-velocity items, keep a list of alternative suppliers but do not spend time qualifying them until a problem surfaces. Speed matters relative to the product’s revenue contribution.
What if my supplier refuses to share performance data?
Start with what you can measure internally: purchase order dates, goods receipt dates, defect reports from inspections. Also ask for basic certifications and check public financial signals. A refusal to share basic data is itself a risk indicator.
How do I handle currency risk in supplier scoring?
Include a currency volatility factor: if your revenue is in IDR and supplier contracts are in USD, add a 10% risk weight to the financial health pillar. Recheck the exchange rate each quarter and adjust the score if the rupiah weakens more than 5%.
Should I drop a supplier after one bad shipment?
No. One bad shipment is not a pattern. Use a rolling 90-day window for scoring. If the supplier’s score drops below 70 after two consecutive orders exceeding the threshold, then activate your backup. A single failure could be logistics-related, not systemic.
The Straight Talk
This article is for operators who manage 5–30 suppliers and cannot justify spending thousands on enterprise supplier risk platforms. If you are a solo founder with two drop-shipped products, the scoring system is overkill—just keep a second supplier on standby. But if you have inventory, real purchase orders, and carry stock, then a basic scorecard saves you money within one quarter.
If you are a procurement manager in a large enterprise already using SAP Ariba or a dedicated SRM tool, you do not need this guide. Your problem is not the system—it is getting your team to use it correctly.
Your next action: Open a Google Sheet, list your top 5 suppliers by revenue, and for each one track: average lead time over the last 3 orders, late delivery count, defect rate. If any supplier shows more than 15% variance or 3% defects, start the search for a backup today.
For deeper reading, check out [Kodiak Hub’s supplier risk management guide](https://www.kodiakhub.com/blog/supplier-risk-management) and the [B2B supply chain risk mitigation framework from Closo](https://closo.co/blogs/blog/supply-chain-risk-mitigation-b2b-resellers). For Indonesia-specific challenges, see our piece on managing payment terms with local suppliers.