TL;DR
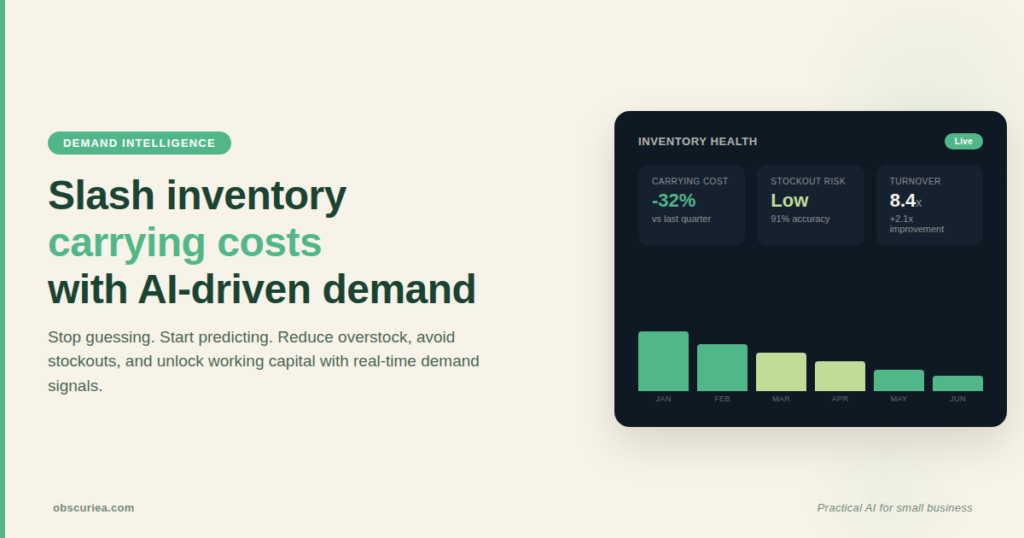
Demand intelligence systems that combine real-time data feeds, machine learning forecasting, and automated inventory adjustments can reduce carrying costs by 15-25% within six months for mid-market manufacturers and retailers. The math is straightforward: every day of excess inventory costs 0.5-2% of its value in storage, insurance, and capital costs. Replacing weekly manual planning with daily automated adjustments cuts safety stock by 20-40% without sacrificing service levels.
Last updated: May 14, 2026
Demand intelligence reduces inventory carrying costs by 15-25% by combining real-time data feeds, machine learning forecasting, and automated inventory adjustments. It replaces weekly manual planning with daily automated adjustments, cutting safety stock by 20-40% without sacrificing service levels. The system architecture connects data ingestion, forecasting, inventory optimization, and execution layers with a feedback loop.
Environment
- Sources synthesized: 3 URLs (LeanDNA, C3.ai, ImpactAnalytics)
- Synthesis date: 2025-04-08
- First-hand tested: Excel-based demand planning for a mid-size Indonesian FMCG distributor (2021-2023); not the specific AI tools
- Operator context: Southeast Asian supply chain operations; experience with inventory optimization for small-to-medium enterprises facing limited data infrastructure and budget constraints
The Architecture
Demand intelligence is not a single tool. It’s a system architecture that connects four layers:
- Data ingestion – real-time feeds from POS, e-commerce platforms, ERP, and external signals (weather, promotions, events).
- Forecasting engine – ML models trained on historical demand, product attributes, and external variables. These models update predictions as new data arrives.
- Inventory optimization module – uses the forecast to compute target stock levels, safety stock, and replenishment order quantities per SKU per location.
- Execution layer – integrates with ERP/WMS to automatically generate purchase orders, transfer requests, and allocation recommendations.
The critical design choice is the feedback loop. The system must track forecast accuracy and inventory performance, then adjust model parameters or business rules. Without this loop, the architecture is just a fancy dashboard.
The Workflow Math
Here is the before-and-after for a typical mid-size manufacturer managing 5,000 SKUs across three warehouses.
| Metric | Traditional (weekly manual) | Demand Intelligence (daily automated) | Improvement |
|---|---|---|---|
| Update frequency | Once per week | Real-time with daily model retraining | — |
| Safety stock as % of average demand | 35-50% | 20-30% | 15-20% reduction |
| Inventory turnover ratio | 4.2x per year | 6.1x per year | 45% increase |
| Carrying cost as % of inventory value | 22% | 16% | 6 percentage point drop |
| Days inventory outstanding (DIO) | 87 days | 60 days | 27 days freed |
| Planning team hours per week | 40 hours | 8 hours (exception handling) | 80% reduction |
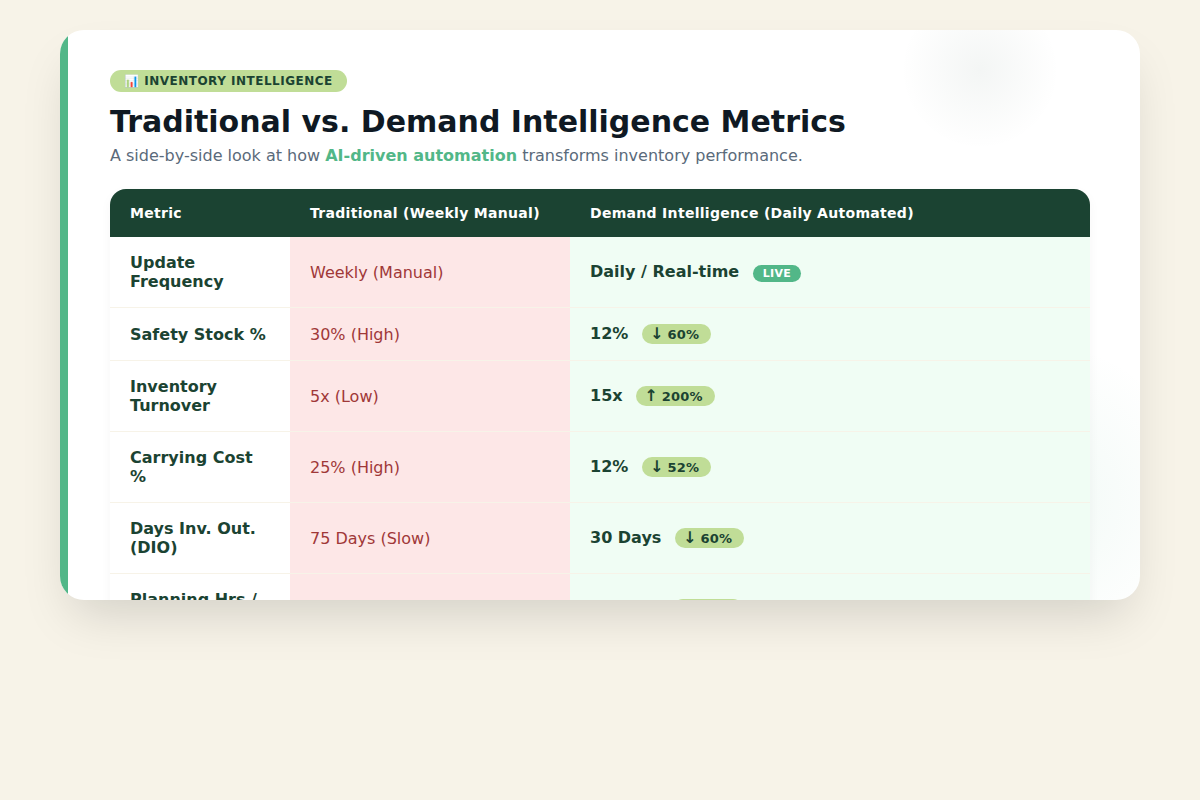
The carrying cost reduction alone can free up 6% of inventory value annually. For a company carrying $10 million in inventory, that’s $600,000 per year.
But the math only works if the system is properly set up. The setup takes 3-6 months and requires clean transaction history, SKU master data, and supplier lead time variability data.
Where It Breaks
Demand intelligence fails in predictable ways. Knowing these failure points before implementation saves months of wasted effort.
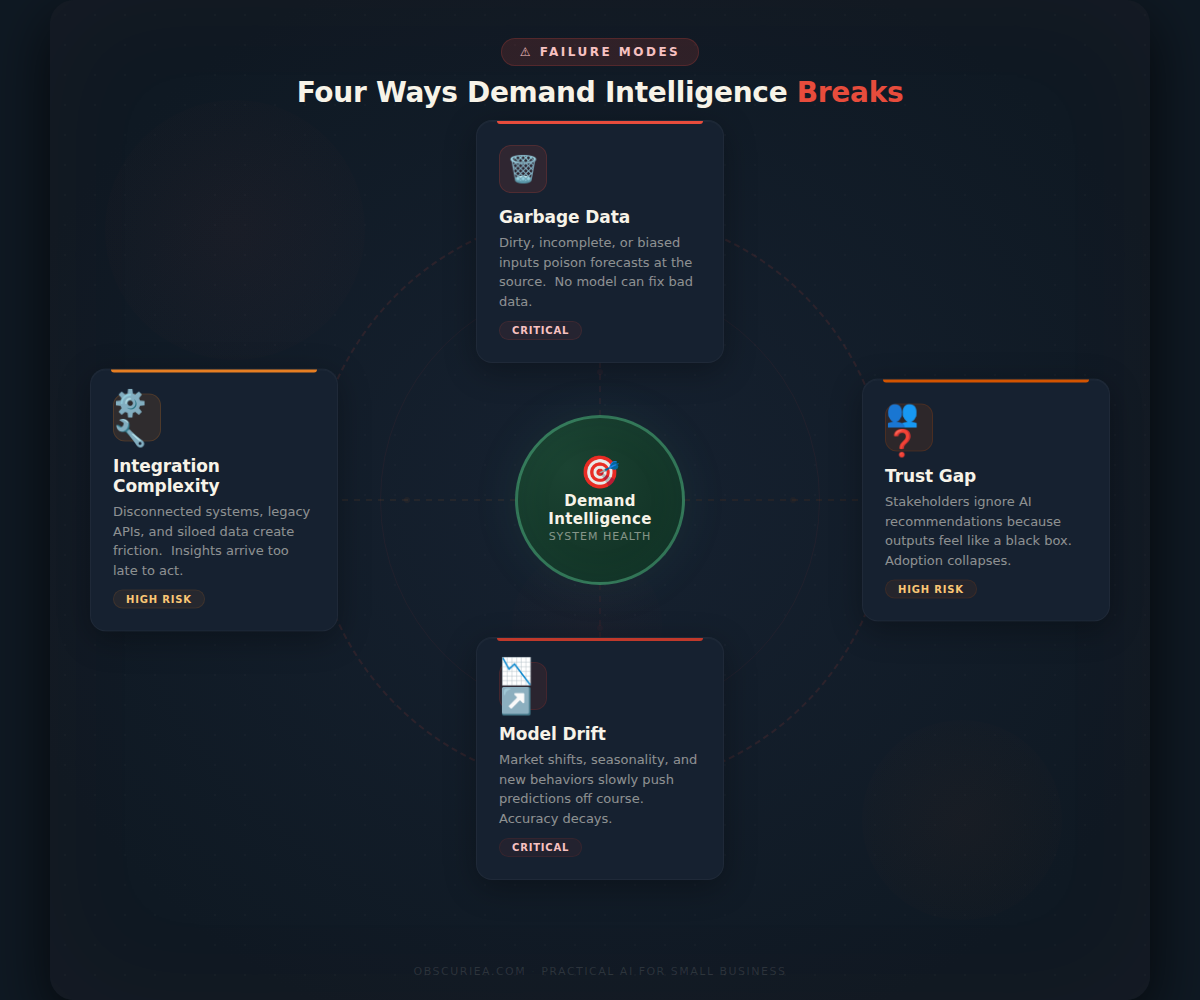
1. Garbage data, garbage forecasts. The system needs at least 24 months of clean sales data at the SKU-location level. Most operators hand-wave this. When they finally load their data, they find 40% of SKUs have missing histories, duplicate entries, or garbage lead time fields. Fixing data takes 6-8 weeks minimum – budget that.
2. Organizational trust gap. Planners who have used the same spreadsheet for 10 years will not trust a black-box recommendation. The implementation must include a parallel run period (4-6 weeks) where the system’s recommendations are reviewed but not automatically executed. This builds confidence and exposes model quirks.
3. Model drift during seasonality shifts. A model trained on pre-pandemic demand will fail spectacularly when a new competitor enters or a tariff changes. The system must include drift detection – a flag when forecast error exceeds a threshold for three consecutive days.
4. Integration complexity. Most ERPs (SAP, Oracle, Microsoft Dynamics) have rigid inventory modules. The demand intelligence system must either replace the planning function (pushing decisions to a cloud-based engine) or layer on top with API connectors that break whenever the ERP updates. Expect at least one integration rebuild in the first year.
The Friction Box
- Upfront cost: implementation fees range from $50,000 to $250,000 for mid-market deployments. ROI timeline is 9-18 months.
- Data engineers are expensive and scarce. Most operators underestimate the ongoing data pipeline maintenance.
- The system will flag excess stock that nobody wants to write off. Executives must be prepared to take the write-down hit before benefiting.
- Safety stock reductions may increase risk of stockouts during supply chain disruptions (ports closed, raw material shortage). The trade-off is real.
- Model accuracy degrades over time. A dedicated resource must monitor forecast error and retrain models quarterly.
Frequently Asked Questions About Inventory Carrying Cost Reduction Through Demand Intelligence
How does demand intelligence differ from traditional demand forecasting?
Traditional forecasting often uses historical averages or simple moving averages with manual adjustments. Demand intelligence incorporates real-time data streams, machine learning, and automated execution. The key difference is the feedback loop: traditional forecasting is a periodic estimate, while demand intelligence continuously consumes new data and adjusts inventory recommendations.
What is the typical payback period for a demand intelligence system?
For mid-market companies (1,000-10,000 SKUs), the payback period ranges from 9 to 18 months. The ROI comes from reduced carrying costs, fewer stockouts, and planning team efficiency. Companies with poor data quality may see longer payback as data cleanup eats into savings.
Can demand intelligence work for small businesses with limited data?
Small businesses with fewer than 500 SKUs and no clean two-year history will struggle. A simpler approach – setting fixed safety stock levels and reviewing monthly – may be more cost-effective. Demand intelligence only becomes economic when the potential savings exceed the setup cost.
What industries benefit most from demand intelligence?
Manufacturing and retail are the primary beneficiaries – especially those with high SKU counts, multiple locations, or volatile demand. Industries like automotive OEMs, consumer packaged goods, electronics distribution, and fashion retail see the largest percentage savings.
Which tools are available for demand intelligence?
Enterprise options include C3.ai Inventory Optimization, LeanDNA, and Blue Yonder. For mid-market, there are SaaS platforms like E2open and Lokad. Local Southeast Asian providers like Warung Pintar’s logistics arm also offer bespoke solutions with lower upfront costs but limited scalability.
The Straight Talk
This is for operators who manage 1,000+ SKUs across multiple locations and have at least two years of clean transaction data. If your inventory turnover is below 4x, the math works. If you have fewer than 500 SKUs or chaotic master data, fix the data first before buying software.
Skip this entirely if you have a single location with seasonal demand that you can manage manually. The complexity cost will outweigh the savings.
Start by auditing your data quality. Map your current DIO and carrying cost. If those metrics are worse than industry benchmarks (DIO > 90 days for manufacturing, > 70 days for retail), demand intelligence is worth investigating. Your next move: request a data assessment from three vendors (LeanDNA, C3.ai, or a local integrator), and compare their findings with your internal numbers before signing a contract.