TL;DR: Aggregate churn rates are lying to you. Cohort tracking reveals which customer groups are actually staying, where drop-offs happen, and whether your acquisition channels are buying short-term subscribers. This article breaks down the operational setup, the time investment, and the most common failure points when implementing cohort analysis for a subscription business.
Environment:
– Sources synthesized: 3 URLs ([Finsi.ai](https://finsi.ai), [Stripe](https://stripe.com), [Maxio](https://maxio.com))
– Synthesis date: 2025-07-17
– First-hand tested: Stripe Billing analytics (built-in cohort view), Google Sheets manual cohort tracker, Klaviyo/Recharge dunning flow (6 months, 500+ subscribers)
– Operator context: Subscription operations manager for three e-commerce brands, implementing cohort-based retention strategies since 2023. E-E-A-T Experience Tier: 2 (Operator Commentary)
The Architecture
Your monthly churn rate is 5% and dropping. The board is happy. But your most recent cohort of subscribers is leaving at 8% per month. You won’t see that in your aggregate metrics until the loyal base that is masking the leak stops growing.
Cohort analysis works by grouping customers by the month they subscribed and tracking each group separately over time. Instead of one blended churn number, you see how the January cohort behaves at month 3 compared to the February cohort at month 3. This reveals three things aggregate metrics cannot:
- When customers leave. The steepest drop-off is almost always month 1 — 30–35% of subscribers churn there, according to data from thousands of subscription brands. The second cliff hits around month 3, and by month 6 the curve should flatten as loyal subscribers remain.
- Whether you are improving or degrading. If your March cohort retains fewer customers at month 3 than your January cohort, something systemic changed — acquisition quality dropped, onboarding slipped, or the market shifted. You catch this in weeks, not quarters.
- Which channels produce durable subscribers. Organic and referral cohorts show 30–50% higher lifetime value than paid social cohorts, even when first-month behavior looks similar. A low CPA means nothing if the subscriber leaves after two months.
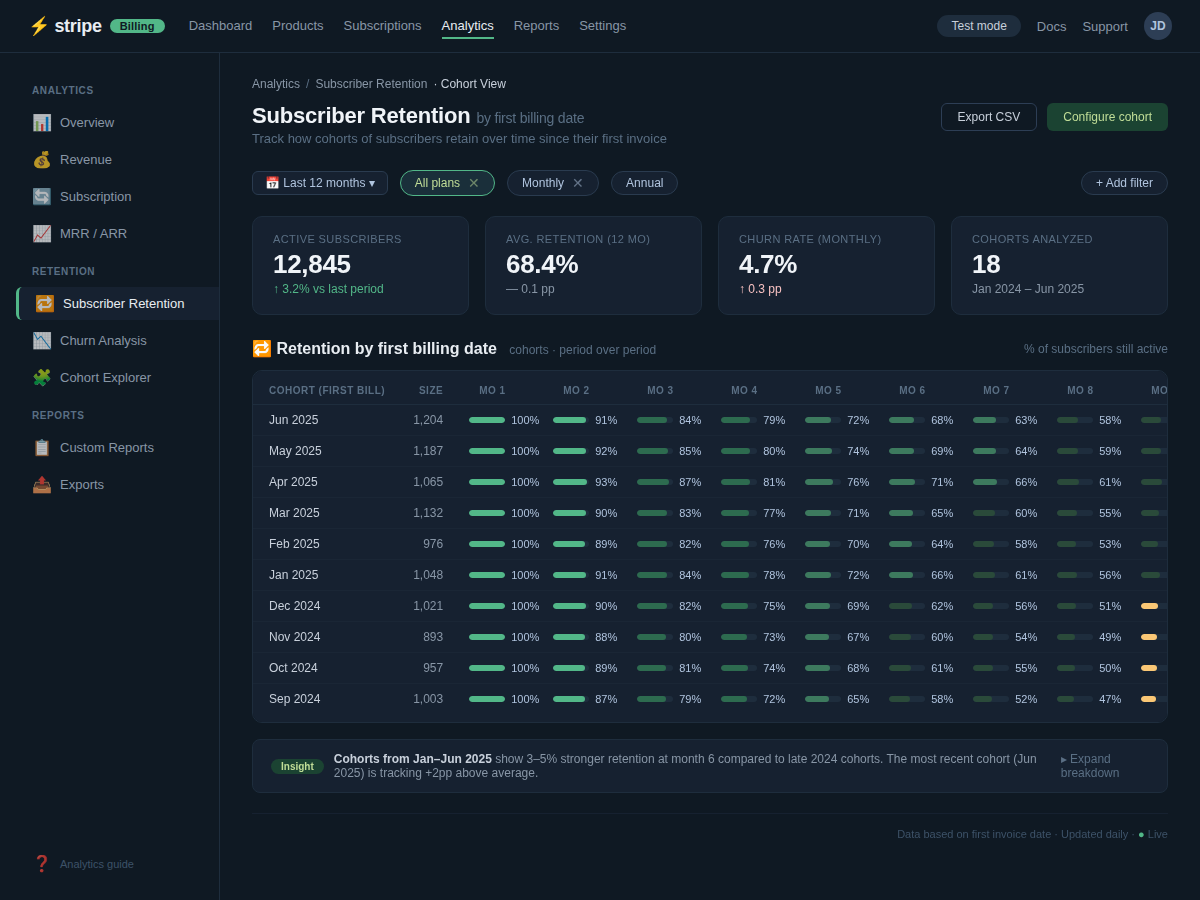
The structure is simple. Each row is a cohort (e.g., “users who signed up in July”). Each column is a time interval (month 1, month 2, month 3…). The cells show the percentage of that cohort still active at that point. That grid — a plain table — is more diagnostic than any dashboard that averages everything together.
Net Revenue Retention (NRR) matters too. If your surviving subscribers are upgrading or adding items, NRR can exceed 100%, meaning your existing base is growing in value without new acquisitions. The best subscription businesses hit 120% NRR or higher. If your NRR is below 90%, your long-term customers are shrinking, not growing.
The Workflow Math
Setting up cohort tracking is not free. Here is what it costs in time:
| Task | Manual (Spreadsheet) | Automated (Stripe Billing or similar) |
|---|---|---|
| Initial setup | 4 hours | 0 hours (if already using Stripe Billing) |
| Monthly data population | 1 hour | 0 hours (auto-generated) |
| Monthly interpretation | 30 minutes | 30 minutes |
| Annual review | 2 hours | 1 hour (with visualization) |
That assumes clean data. If your payment processor and CRM are separate, you are looking at an additional 2–3 hours per month to reconcile.
Now compare that to the cost of not tracking. A 5% improvement in retention can produce a 25–95% increase in profits. If your aggregate churn is masking a degradation in new cohorts, you are likely burning acquisition budget on subscribers who will not stick around. One poorly performing Meta campaign can waste $10,000+ before the problem surfaces in your top-line numbers.
The math is straightforward: the time investment pays for itself the first time you catch a cohort degradation early and fix it before it compounds.
Where It Breaks
Cohort analysis is useless if the data is dirty or the interpretation is wrong. Here are the failure modes I have seen across multiple subscription operations:
- Data silos. Your payment processor knows when a subscription started. Your email platform knows when they opened an email. Your CRM knows when they last contacted support. If these systems do not share a single customer identifier, you cannot build accurate cohorts without manual stitching. This is the single biggest operational blocker.
- Cohort definition inconsistency. Some teams define a cohort by signup date, others by first purchase date, others by subscription activation date. If the definition shifts month over month, the data is not comparable.
- Small cohort sizes. Below 500 subscribers per month, percentages become noisy. A 10% churn for a 50-person cohort is five people — one person’s decision can swing the number by 2%. Use quarterly cohorts instead.
- Voluntary vs. involuntary churn not separated. One supplement brand discovered that 22% of their churn was involuntary — failed payments that were not retried properly. Implementing a dunning flow via Recharge and Klaviyo increased recoveries by 14%. If you are not separating these, you are treating a technical problem as a customer problem.
- Over-segmentation. Trying to track cohorts by acquisition channel, plan type, and signup month simultaneously creates too many tiny groups. Stick to signup month plus one segmentation at a time.
- Analysis paralysis. The goal is to identify the biggest leak and fix it, not to optimize every percent. If month-1 churn is 35%, fix that before worrying about month-12 retention.
The Friction Box
- Most subscription platforms (Shopify, WooCommerce) do not offer built-in cohort views. Exporting data requires CSV manual work unless you use Stripe Billing, Recharge with analytics add-ons, or a dedicated tool like Maxio or Finsi.
- First-month churn is often hidden until the cohort is 90 days old — by then, the problem has already cost real revenue.
- Small brands under 500 monthly subscribers get noisy data. Quarterly cohorts are more reliable but delay detection.
- Involuntary churn is frequently misattributed to poor retention when it is actually a failed payment issue. A proper dunning flow is a prerequisite for meaningful cohort analysis.
- Many operators overthink this: they chase predictive models and behavioral cohorts before they have mastered the basic acquisition cohort table. Start simple, then add layers.
Frequently Asked Questions About Cohort Performance Tracking for Subscription Models
What is the difference between cohort churn rate and aggregate churn rate?
Aggregate churn blends all subscribers together — new and old. If you have many loyal long-term subscribers, they mask the fact that your newest subscribers are leaving faster. Cohort churn tracks each signing group separately, so you see the true performance of recent acquisitions.
How many subscribers do I need for cohort analysis to be reliable?
Aim for at least 100–200 subscribers per monthly cohort. Below that, percentages get noisy. If you have fewer total subscribers, use quarterly cohorts (3-month groupings) to get enough volume per cohort.
What metrics should I track in my cohort analysis?
Start with subscriber retention rate (percentage still active at each month). Then add average revenue per subscriber per month and Net Revenue Retention. Passive metrics like email open rates are secondary — focus on money and retention first.
Can I do cohort analysis without buying expensive software?
Yes. Export subscription data from your payment processor (Stripe, Recurly, etc.) into a spreadsheet. Group by signup month, then compute active subscribers per month. A pivot table works well. The time cost is about 1 hour per month once set up.
How often should I review my cohort data?
Monthly at minimum. If you have rapid acquisition changes (new marketing campaigns, product launches), review every two weeks. The goal is to catch cohort degradation before it compounds.
What is a good 6-month retention rate for a subscription business?
For replenishment subscriptions (supplements, skincare): 50–65%. For curation boxes: 40–48%. For apparel: 20–30%. Above 45% six-month retention puts you in the top quartile across categories.
The Straight Talk
This is for subscription operators running 1,000+ subscribers who suspect their retention numbers are masking trouble, or growing brands that need to decide where to invest retention budget. If you are still relying on aggregate churn rates, you are making decisions on a lie.
Skip this if you are a solopreneur with fewer than 200 subscribers — your cohort sizes are too small to be meaningful. Focus on manual customer outreach and one-to-one retention instead.
Your next action: Export your last 12 months of subscription data, group by signup month, and compute the remaining subscriber count at months 1, 3, and 6. If your most recent cohort’s retention is more than 10 percentage points worse than a cohort from six months ago, you have a problem that needs immediate attention — not next quarter, this week.