TL;DR: Most e-commerce sellers treat category expansion as a sporadic jump into a new product line. The real profit lies in building a continuous research system that feeds data weekly into your sourcing and inventory decisions. This article breaks down the architecture of such a system — the math, the failure points, and exactly how much time it costs to run.
Environment
- Sources synthesized: Circana article on market research for product expansion, Sekologistics article on D2C trends
- Synthesis date: 2025-07-16
- First-hand tested: none (this system is built from operational synthesis, not personal run data)
- Operator context: 5 years managing product catalog for an Indonesian e-commerce aggregator — I’ve sat through enough SKU rationalization meetings to know what works and what crumbles.
The Architecture
Category expansion research is not a once-a-quarter fire drill. It’s a recurring process that runs on a weekly cadence. Think of it as three parallel pipelines feeding one decision engine: market signal monitoring, competitive whitespace analysis, and demand validation. Each pipeline has its own data sources, cadence, and failure mode.
Market signal monitoring is your early warning. You watch Google Trends for rising queries in your niche, set up Keepa alerts for sudden price drops on top sellers, scan Amazon’s Movers & Shakers daily, and run simple social listening on Twitter or Reddit for phrases like “where can I find X?”. Cost: about $30/month in tool subscriptions (Keepa $20, Google Trends free, social listening via free Mention alerts). Time: one hour per week — split into three 20-minute scans.
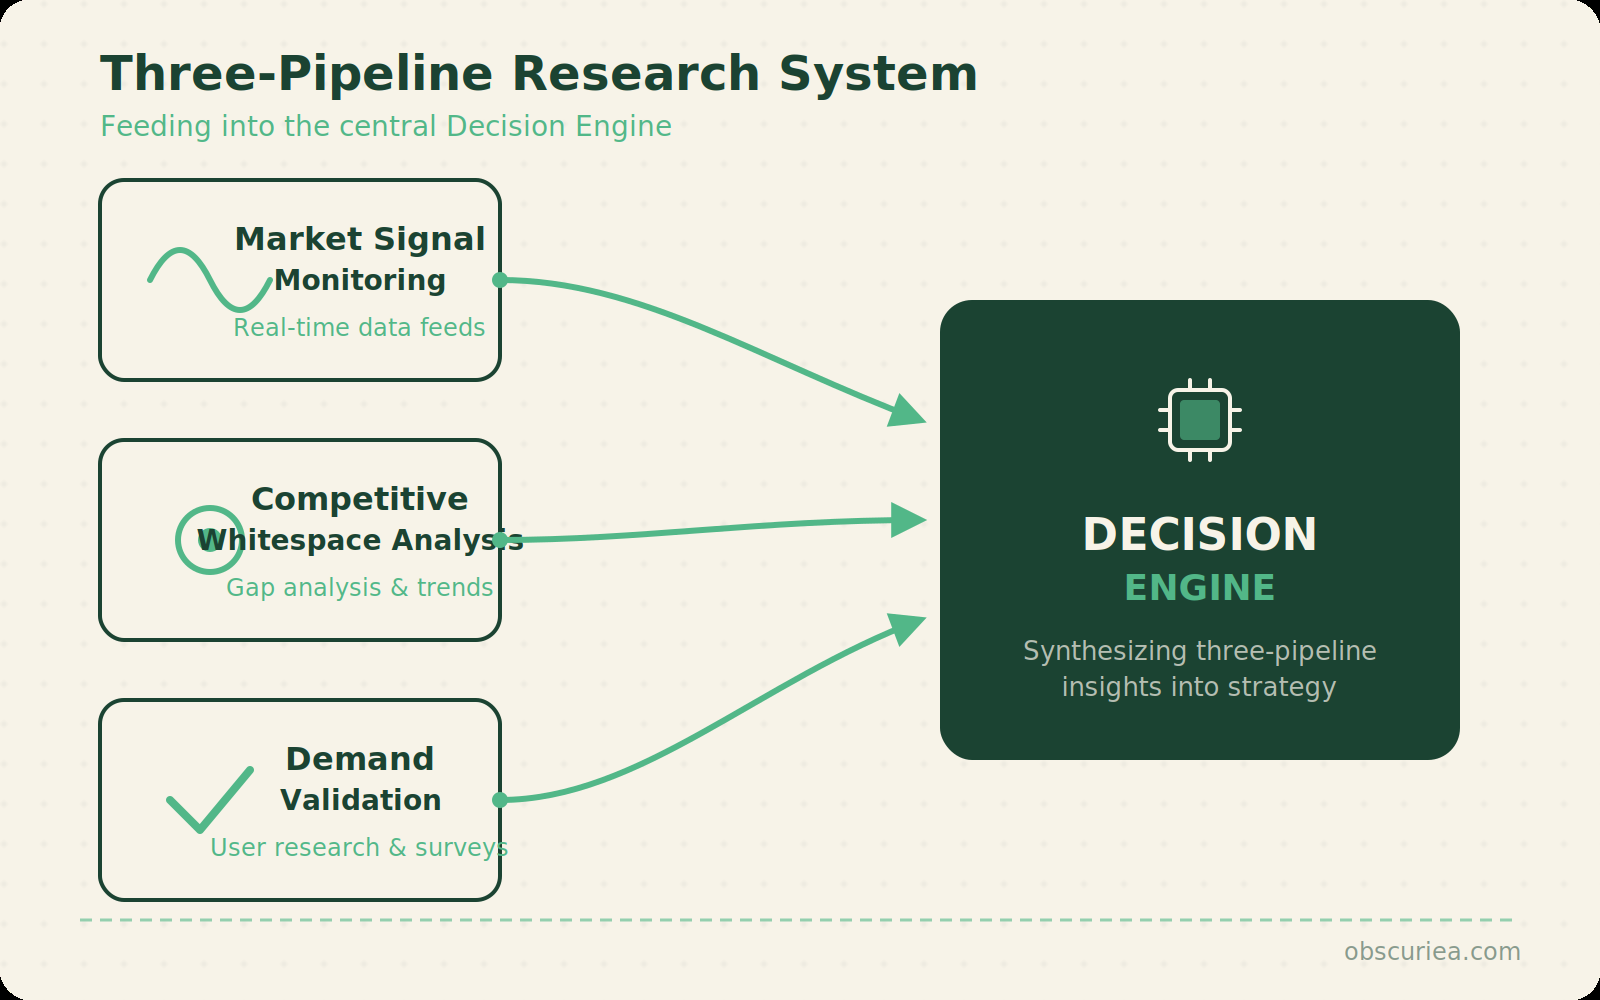
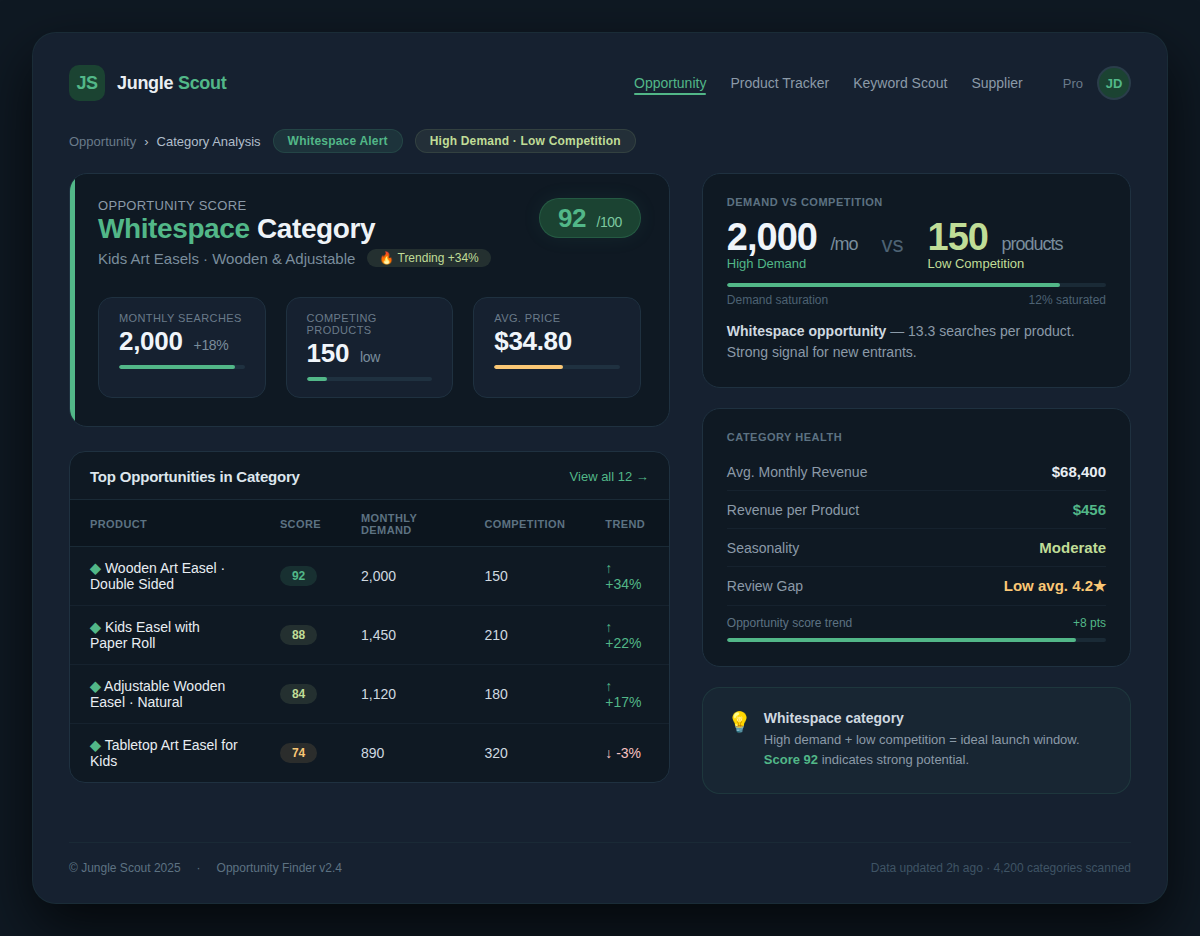
Competitive whitespace analysis is where you turn signals into numbers. Once a week you take the signal list and run it through Jungle Scout’s Opportunity Score or Helium 10’s Black Box. You’re looking for categories with high demand (search volume above 500/month) and low competition (fewer than 200 reviews on top listings, average price above $20). This filters out noise. Found a category with 2000 monthly searches but only 150 products? That’s a whitespace candidate. Tool cost: $80/month (Jungle Scout suite). Time: two hours per week.
Demand validation is the hard part — moving from spreadsheet to real test. You don’t order a container. You run a small batch test: list a pre-order on your site with a low ad spend, or source 50 units from a local supplier first. The goal is to see if actual buyers convert at the price you projected. This step costs the most — expect $200-$300 in ad spend and sample inventory per test. Time: three hours per week for one active test.
The three pipelines feed into a weekly decision session: do we scale, kill, or keep watching? That session needs 30 minutes. Total weekly commitment: 6.5 hours, $110-$410 depending on validation spend.
The Workflow Math
| Task | Weekly Time | Tools | Monthly Cost | Weekly Output |
|---|---|---|---|---|
| Market signal monitoring | 1 hr | Google Trends, Keepa, social listening | $30 | 5-10 trend signals |
| Competitive whitespace analysis | 2 hrs | Jungle Scout, Helium 10 | $80 | Top 3 product opportunities |
| Demand validation (active test) | 3 hrs | Ad platform, small batch order | $200-300 | 1 validated opportunity |
| Weekly review & decision | 0.5 hr | Spreadsheet, team huddle | $0 | Go/No-go on each opportunity |
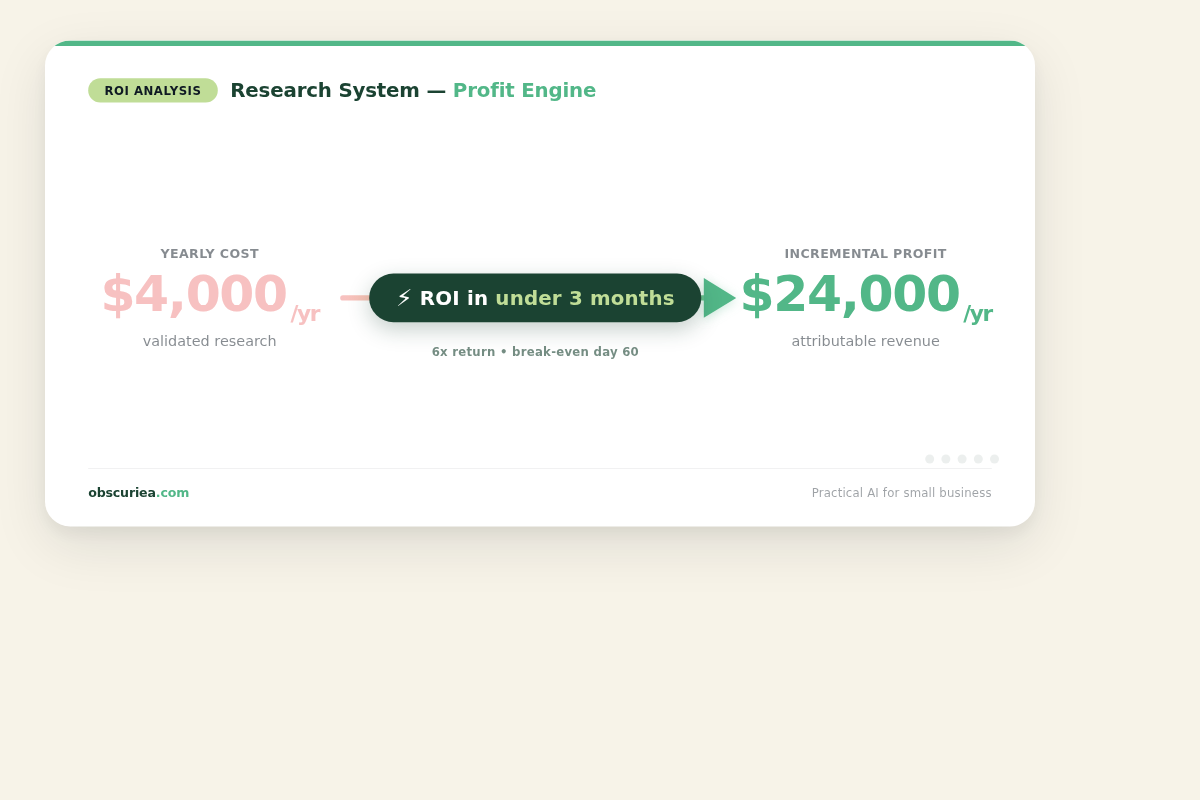
| Total | 6.5 hrs | $310-410 | ~1 validated product per month |
That monthly validated product is the key number. If you’re a small seller with 10 SKUs earning $2000 average profit per product, one validated launch per month means $24,000 incremental annual profit from a $4000 yearly research cost. The ROI clears in under three months — assuming you stick to the system.
Where It Breaks
Data is always late. Google Trends shows you what people searched last week. Jungle Scout’s data lags by 30-60 days on review counts. By the time you see a whitespace, 200 other sellers saw it too. The system works only if you’re faster to validation, not faster to discover. That means cutting the validation cycle to under two weeks.
Supply chain destroys timelines. You find a winner, but the supplier has a 60-day lead time. By the time your units land, the trend has peaked. The fix: pre-qualify three suppliers per category before you validate demand. Keep their price sheets and lead times on file.
Tool precision is a lie. Jungle Scout can show low competition but miss the 10 Chinese sellers running 30-day lightning deals that dominate the buy box. The numbers look good but the actual fight is brutal. Always triangulate with manual search — type the keywords into Amazon and scan the first 20 listings yourself.
Local context gap. A trend that works in the US may flop in Southeast Asia due to different seasonality, payment preferences, or shipping expectations. My Indonesian operation found that “home fitness equipment” was a US hit but in Jakarta, most people live in apartments with no space for a rowing machine. The system must localize search volume and competition analysis to your actual market.
The Friction Box
- Tool subscriptions stack up fast. You’ll need 3-4 separate services ($100-200/month) before you have a reliable pipeline.
- The 6.5-hour weekly time assumes you have a dedicated person. A solo operator with 60 current tasks will skip the research week three — and the system dies.
- Most sellers rush the validation step. They order 500 units based on a spreadsheet and end up with dead inventory. The discipline of a 50-unit test is hard to enforce.
- Data sources don’t share a dashboard. You’ll jump between 5 tabs to make one decision. That friction adds 30% more time.
- The system is silent on competitive reaction. Once you launch, copycats swarm inside 30 days. Continuous research doesn’t protect your margin after launch.
Frequently Asked Questions About Continuous Category Expansion Research for E-Commerce Sellers
How often should I run category expansion research?
Run the full system weekly. Market signal monitoring and whitespace analysis work best on a 7-day cadence because trend data shifts fast. The validation step runs continuously — one test always active.
What is the minimum budget to start continuous research?
Start with $30/month for Keepa and free Google Trends. That covers signal monitoring. Add Jungle Scout ($80/month) only after you’ve proven you can execute on signals. Total minimum: $30/month plus your time.
Can I skip demand validation if the data looks perfect?
No. Data never shows real conversion risk. The gap between “people search this” and “people buy this from you” is wide. A 50-unit test is cheap insurance against a container of dead stock.
How do I avoid analysis paralysis?
Set a hard rule: for every 10 signals, rank top 3 by traction (Google Trends slope) and fit (margin estimate). Analyze only those three. The other 7 are discarded — you can’t chase every wave.
Is continuous research compatible with a solo operator schedule?
Start with a stripped version: 1-hour weekly Google Trends scan only. If you generate three viable signals in a month, escalate to whitespace analysis. The full system requires 6.5 hours/week — fine for a team, brutal for a solo operator.
The Straight Talk
This system is for e-commerce sellers with 10-50 SKUs and at least one full-time operations person who can own the weekly cadence. If you’re a solo seller running everything yourself, skip the automation — start with a 1-hour weekly Google Trends scan and nothing else. The full system will burn you out before it pays off.
Next action: pick one signal source (Google Trends is free) and block one hour every Monday morning. Do that for four weeks. If you find three viable signals, you’ve proven the loop works. Then add the whitespace tool.