The Deflationary Pressure of Mass Automation Adoption
TL;DR: AI automation is already bending the cost curve in ways that show up in hard data: labor productivity rising faster than hours worked, supply chain costs dropping for early adopters, and a measurable disinflationary macro effect. But for operators running real businesses, the gains are uneven – enterprise giants pocket billions while smaller operations face a frustrating gap between promise and practical return. This article breaks down the architecture, the math, and where it breaks for operators who need to make decisions with real money.
Environment:
– Sources synthesized: 3 URLs (Ethenea investment analysis, Pinnacle Digest macro contrarian, Monetizely software industry deep-dive)
– Synthesis date: July 2025
– First-hand tested: None – synthesis-based analysis drawing on published data and market reports.
– Operator context: The writer has overseen operations for small-to-medium businesses in Southeast Asia, including e-commerce fulfillment and service businesses evaluating automation tools. The perspective is that of an operator reading macro data through a practical lens.
The Architecture
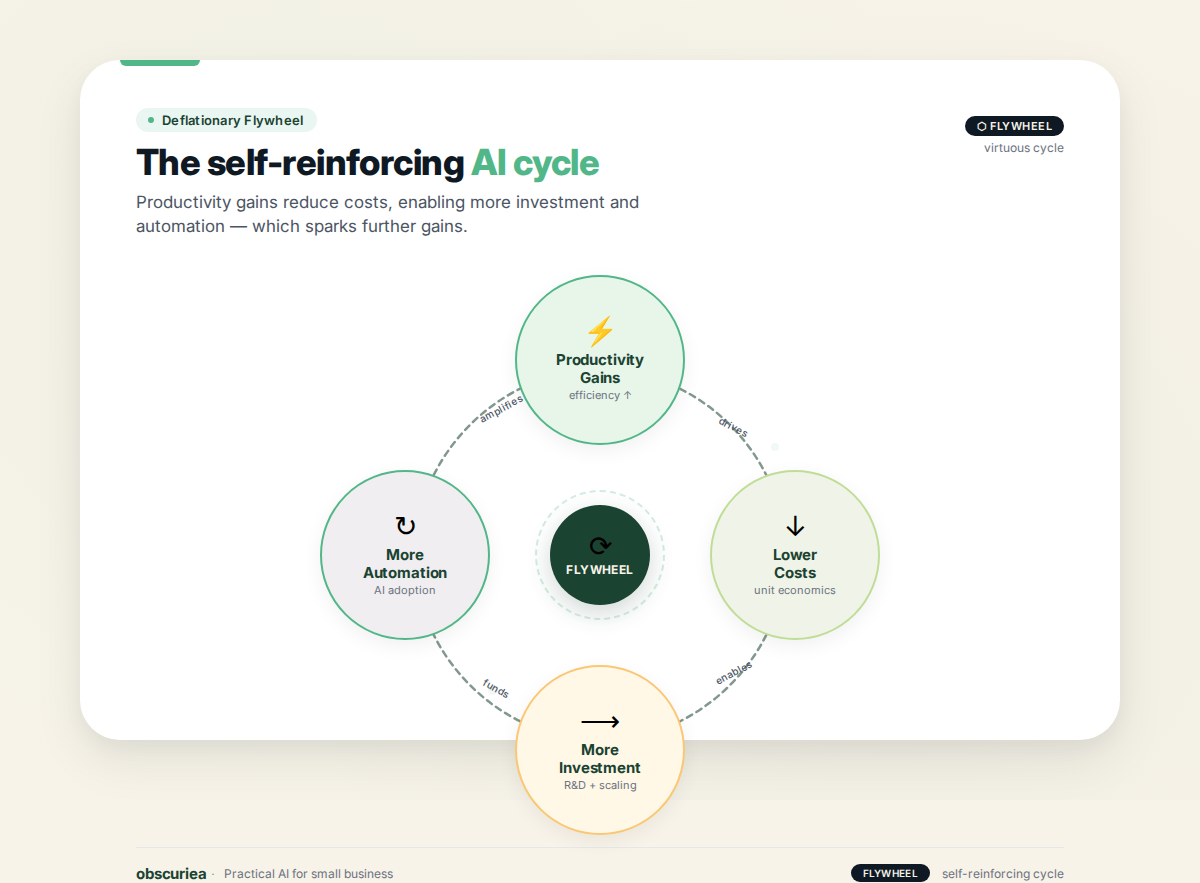
The deflationary mechanism of AI automation operates like a crank that turns in one direction only – once set in motion, it self-reinforces. Here’s the architecture: Step one: a company deploys AI to automate a process. This could be demand forecasting in a warehouse, document processing in an accounting department, or code generation in a development team. Instantly, the labor hours required to produce a unit of output drop. The U.S. Bureau of Labor Statistics [BLS](https://www.bls.gov/) captured this in Q2 2025: nonfarm business productivity rose 2.4% while hours worked rose only 1.3%.
Step two: those labor savings hit the cost structure. Your cost per unit falls. If you sell something, your margin expands. In competitive markets, that margin pressure eventually forces prices down.
Step three: lower prices or better margins free up capital for further automation investment. Gartner [Gartner cloud spending forecast](https://www.gartner.com/) noted global public-cloud spending hit USD 675 billion in 2024, with IaaS growing 25.6%. NVIDIA’s data center revenue hit USD 26.3 billion in a single quarter, up 154% year-on-year. That is the investment side of the flywheel.
BNP Paribas Research [BNP Paribas productivity-inflation link](https://www.bnpparibas.com/) quantifies the macro effect: each percentage point of productivity growth can shave up to a full point of annual inflation. The Bank for International Settlements [BIS](https://www.bis.org/) agrees – when total factor productivity climbs, supply outpaces demand, and prices decelerate.
This is not controversial. It is happening. The question for an operator is not whether it’s real, but whether it arrives at your desk with the same force as it does at Maersk or Walmart.
The Workflow Math
Let’s ground the architecture in numbers that matter to an operator.
McKinsey [McKinsey AI manufacturing survey](https://www.mckinsey.com/) found that 61% of manufacturers report lower costs after adopting AI, with 41% achieving cost savings between 10% and 19%. Fifty-three percent also report higher revenues – suggesting automation doesn’t just cut; it expands capacity.
The Tony Blair Institute [Tony Blair Institute AI adoption UK](https://institute.global/) estimates that full AI adoption in the UK could free up nearly a quarter of private-sector working hours – the equivalent of six million full-time employees annually. The same analysis finds that the sensitivity of price inflation to unemployment decreases by 17% and wage inflation sensitivity drops by 9%.
MIT economist Daron Acemoglu adds: AI reduces labor costs of automatable tasks by 27%, which can translate into economy-wide savings of up to 15%. Output rises without wages growing at the same pace.
Now compare at the firm level:
| Metric | Enterprise (Walmart) | Mid-market manufacturer | Small business |
|---|---|---|---|
| Annual savings from AI | $1.5 billion (inventory) | 10-19% cost reduction | $5,000-20,000 range? |
| Implementation cost | $multi-million project | $50k-500k | $5k-50k |
| Payback period | months | 6-18 months | 12-36 months |
| Data infrastructure | mature, dedicated teams | moderate | minimal or manual |
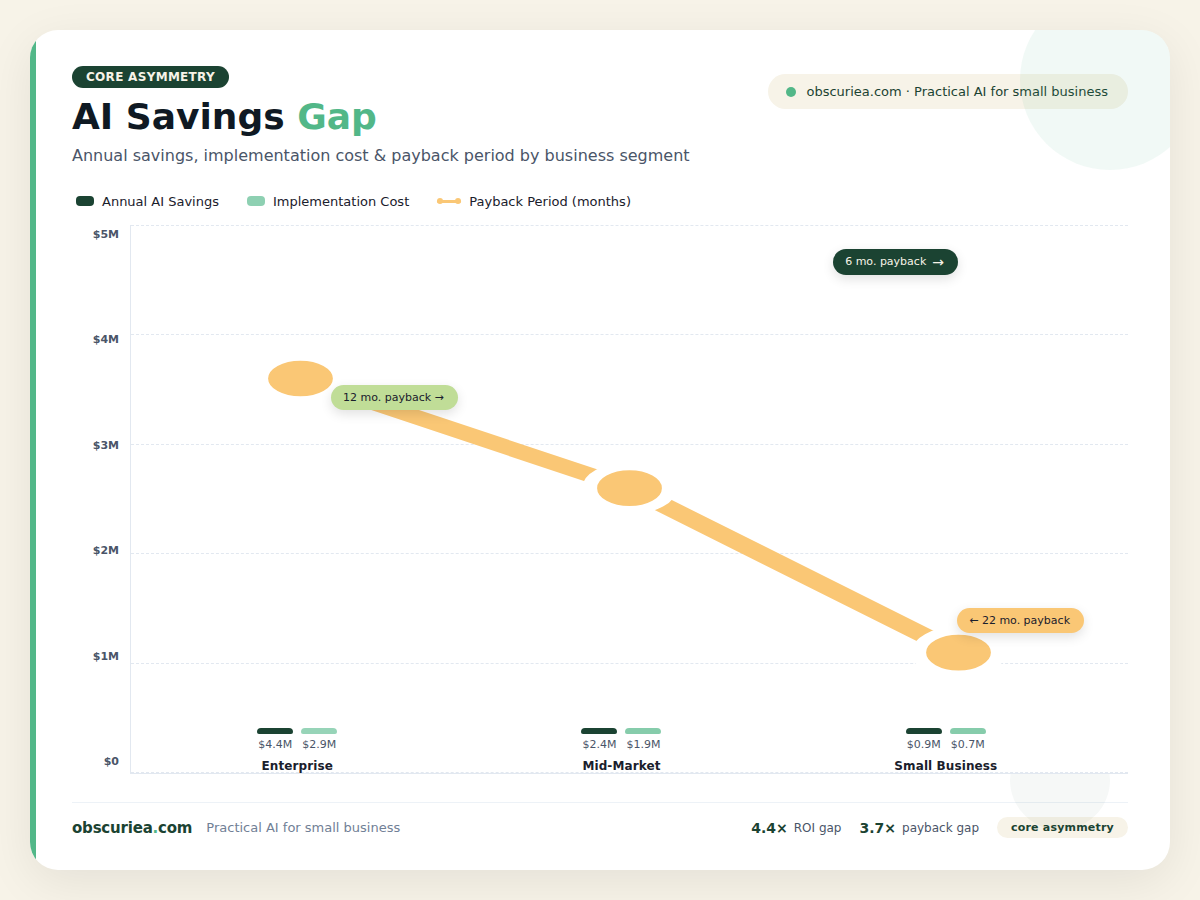
The small business column is speculative because most studies don’t cover it – and that silence is itself a finding. The deflationary pressure is strongest at scale because the fixed costs of AI implementation spread across a larger output base. An enterprise with 100,000 SKUs can amortize a $2 million inventory AI project over billions in revenue. A small e-commerce seller with 500 SKUs would struggle to justify a $20,000 implementation unless the savings are immediate and large.
This is the core asymmetry of AI deflation: the gains compound faster for those who are already large. The operator in a growing mid-market business sits in a promising but precarious middle – large enough to benefit, small enough to feel every dollar of setup cost.
For more on how pricing structures impact automation decisions, see AI SaaS Pricing Disruption.
Where It Breaks
The architecture and the math describe a clean machine. The operational reality is messier. Here’s where the deflationary model breaks for real operators:
The minimum viable automation threshold. Some processes are too small or too variable to benefit from AI. If you spend four hours a week on a task, and the automation tool costs $200/month plus two days of setup, the math doesn’t work. The operator has to accept that not everything can be automated profitably.
Data hygiene drag. AI models are only as good as the data they train on. Most small-to-medium businesses have patchy data – spreadsheets with inconsistent formatting, disconnected CRM and inventory systems, decades of legacy habits. Cleaning that data to a level where an AI tool can work reliably can take months. The cost of data preparation is frequently underestimated by a factor of three or more.
Consider a distributor in Jakarta with 15,000 SKUs stored across three warehouses, each using a different inventory management software. To implement AI-driven demand forecasting, you first need to unify that data. The unification project alone could cost $30,000 and take four months – before the AI tool is even purchased. For a business doing $2 million in annual revenue, that’s 1.5% of revenue just to prepare the ground.
SaaS cost creep. The subscription pricing model that made software accessible now works against operators as they scale. A tool that costs $50/month for basic automation might jump to $500/month when you need advanced features or higher usage limits. At some threshold, the tool’s cost eats the margin it generates, and the operator faces a choice: accept lower net savings or invest in building custom automation in-house – which brings its own risks.
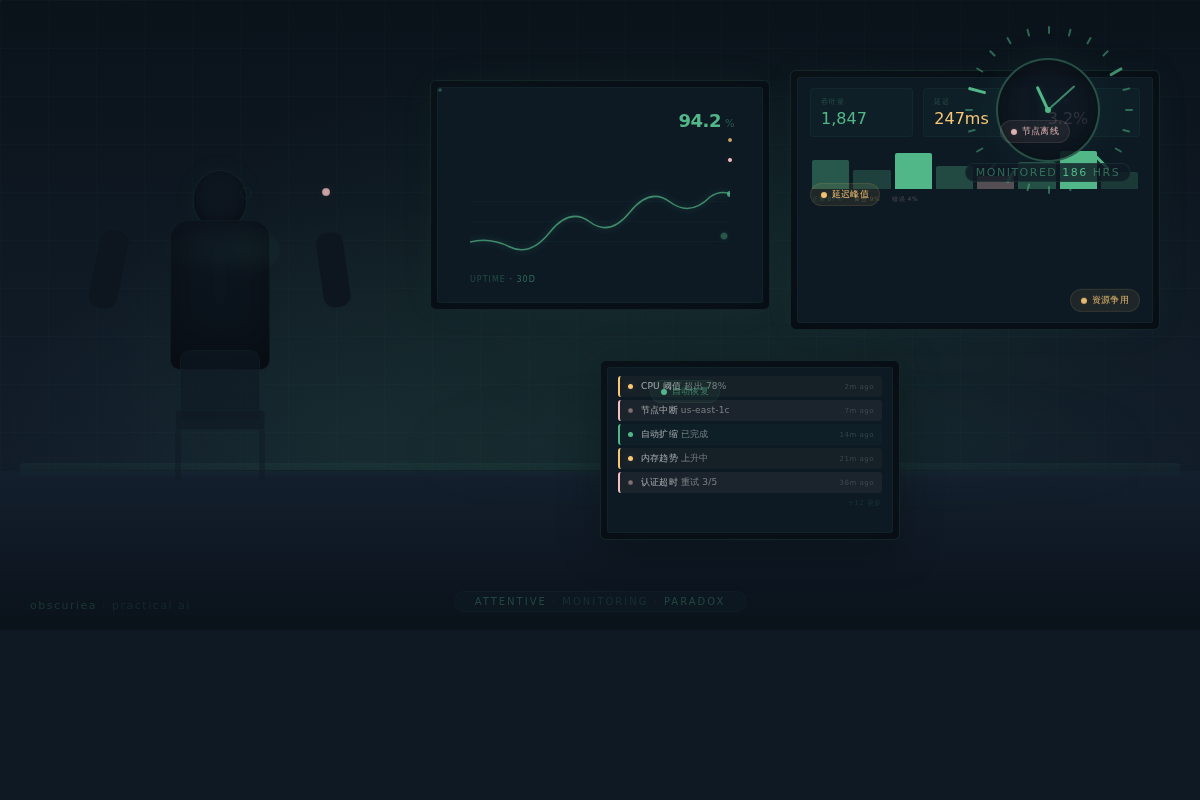
The monitoring paradox. Automation reduces the need for manual execution but creates a new need for monitoring and exception handling. Someone has to watch the automated system, verify its outputs, handle edge cases it misses, and retrain it when conditions change. Operators often underestimate this ongoing cost. A process that took 10 hours of manual work might become 4 hours of monitoring plus occasional correction – still a gain, but not the 10x reduction the vendor promised.
Vendor-case-study gap. The marquee numbers – Maersk cutting vessel idle time by 30% and saving $300 million annually, Amazon running 520,000 robots, Walmart saving $1.5 billion – come from organizations with proprietary data sets and dedicated AI teams. They built the systems themselves or commissioned bespoke solutions that cost millions. A generic SaaS tool is not the same thing. Operators who compare their results to the Walmart example will always be disappointed.
Timeline mismatch. Macro deflationary effects show up over years. The quarterly earnings pressure on a small business is real today. An operator cannot wait for the aggregate productivity curve to bend; they need results in months. This mismatch between macro and micro timelines is a source of genuine frustration. The macro trend is deflationary, but your personal cost structure might not feel it until year three.
The Friction Box
- The data barrier: clean data is expensive, and most automation projects fail not on the AI model but on the data pipeline.
- The scaling cliff: tools that are affordable at low usage become uneconomical as you grow, requiring re-evaluation every 6-12 months.
- The education tax: training employees to work with AI tools is an unmeasured cost that can offset first-year savings.
- The integration trap: point solutions that automate one task often create manual handoffs to other systems, shifting bottlenecks rather than eliminating them.
- The cultural friction: teams resist automation that changes their workflows, and that resistance can delay or diminish projected savings.
- The vendor uncertainty: the AI tool landscape is volatile; a tool you adopt today could be acquired, change pricing, or be discontinued within 18 months.
Frequently Asked Questions About AI Automation Deflation
Does AI automation always reduce costs?
No. AI automation reduces costs only when the process is repetitive, data is clean, and the implementation cost does not exceed the savings. For many small operations, the setup and maintenance costs outweigh the benefits in the first year. The deflationary effect is strongest at scale.
How long until the average small business sees deflationary benefits from AI?
Typically 12 to 36 months – and only if the business has clean data and chooses a specialized tool targeting a high-repetition task. The macro deflationary effects will reach small businesses eventually, but not in the first wave. Operators should expect a slower curve than enterprise case studies suggest.
What’s the biggest mistake operators make when adopting AI automation?
Underestimating data preparation time and cost. Most operators focus on the AI model and subscription price, then get blindsided by the months of data cleaning and process redesign needed to make the tool work. A 2023 study by Gartner found that 80% of AI projects stall at the data stage.
Are the deflationary effects of AI permanent or temporary?
The productivity gains are permanent – once a process is automated, the efficiency improvement rarely reverses. However, the pricing effects on consumers may be temporary if AI enables new demand or if the cost savings are captured as profit rather than passed on as lower prices. The net effect over decades is structural deflation, as seen with software prices which fell 74% over 25 years.
Does AI automation lead to job losses in the long run?
Historically, automation has eliminated specific roles but created new ones – the spreadsheet eliminated accounting clerks but created financial analysts. The deflationary pressure comes from the fact that new roles often require different skills and may not absorb all displaced workers immediately. The net effect on total employment is not yet clear, but the price-dampening effect on goods and services is well-documented.
What types of businesses benefit most from AI deflation?
Businesses with high transaction volumes, standardized processes, and mature data infrastructure benefit most. Think large retailers, logistics providers, and software companies. Small service-based businesses with varied workflows and little data are least likely to see deflationary gains in the near term. For a deeper look at who wins and who loses, see Automation and Workforce Reallocation.
The Straight Talk
If you run a business with annual revenue over $5 million and have reasonably clean operational data, AI automation offers genuine deflationary gains that compound over time. Find the highest-repetition, lowest-decision task in your operations and automate it first. Expect a 12- to 18-month payback period.
If you run a smaller operation, be skeptical of the case studies and focus on low-cost, single-purpose tools. The deflationary wave will reach you, but it arrives later and with less force. Your first automation should save you at least five hours per week – anything less is not worth the setup friction.
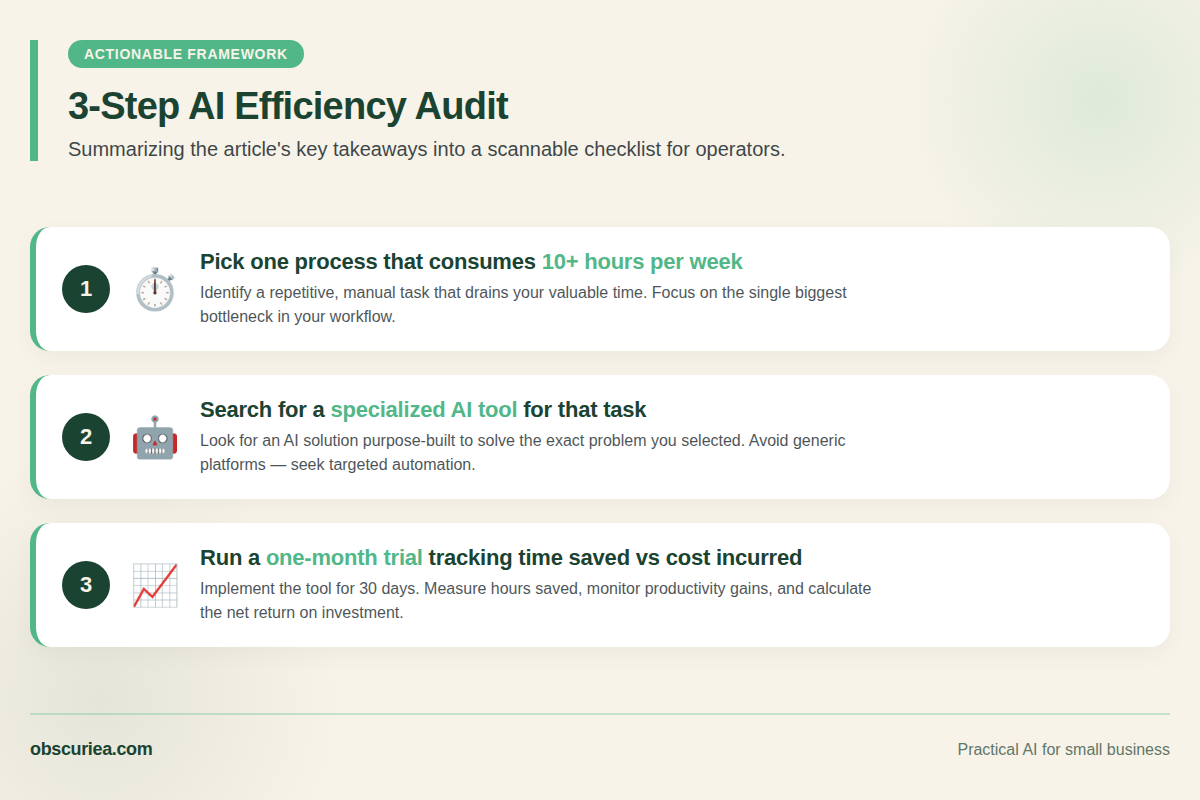
Your next move: pick one process that consumes 10+ hours of your week. Search for a specialized AI tool for that exact task (not a platform, a tool). Run a one-month trial. Track time saved and costs incurred. If you don’t see a clear positive return by the end of the trial, you have your answer – and that answer is valuable data, not a failure.
Further reading: How AI Reshapes Small Business Margins