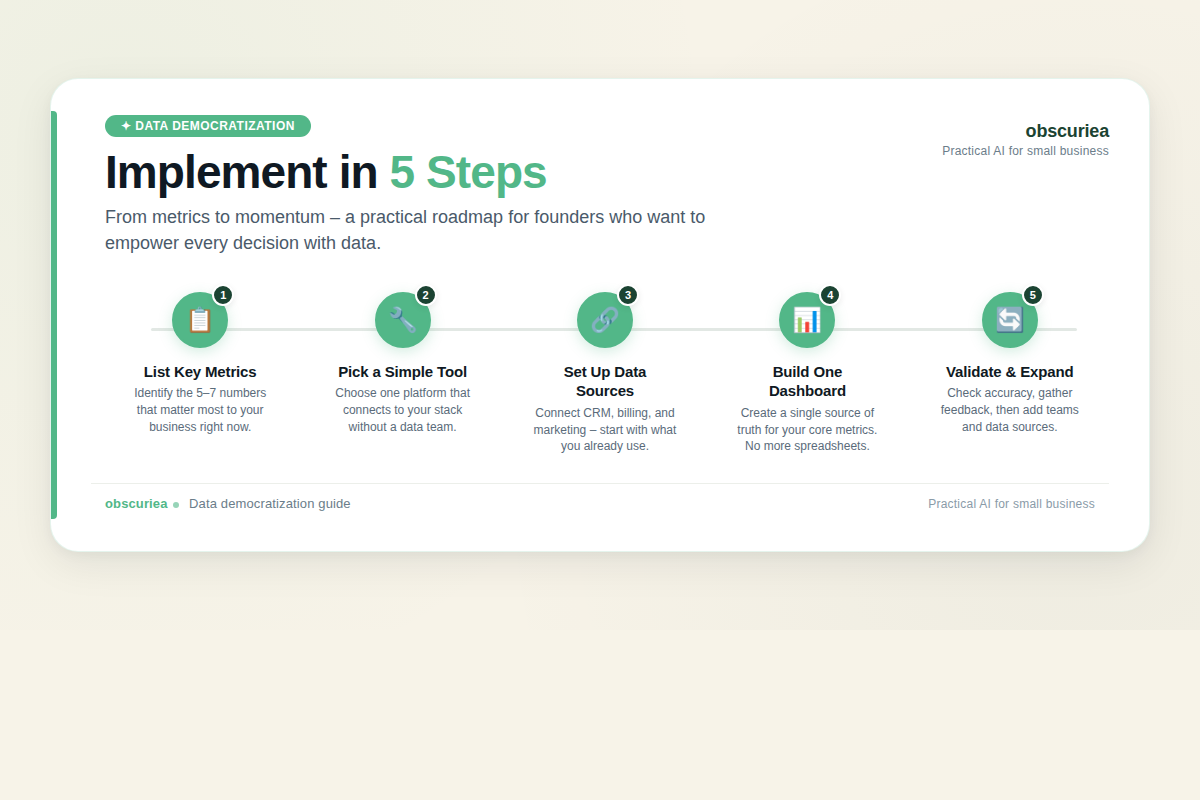
TL;DR: Data democratization isn’t just a buzzword—for non-technical founders, it’s about getting answers without hiring a full-time analyst. The real challenge is selecting the right tool and committing to the setup time before you see any ROI. Here’s how to make data analytics work for a solo operator or a tiny team.
Environment:
– Sources synthesized: 3 URLs (omni.co, querio.ai, databricks.com)
– Synthesis date: 2025-03-31
– First-hand tested: none
– Operator context: I’ve consulted with small business owners on analytics tooling, focusing on the operational reality of founders who are not data engineers.
The Architecture
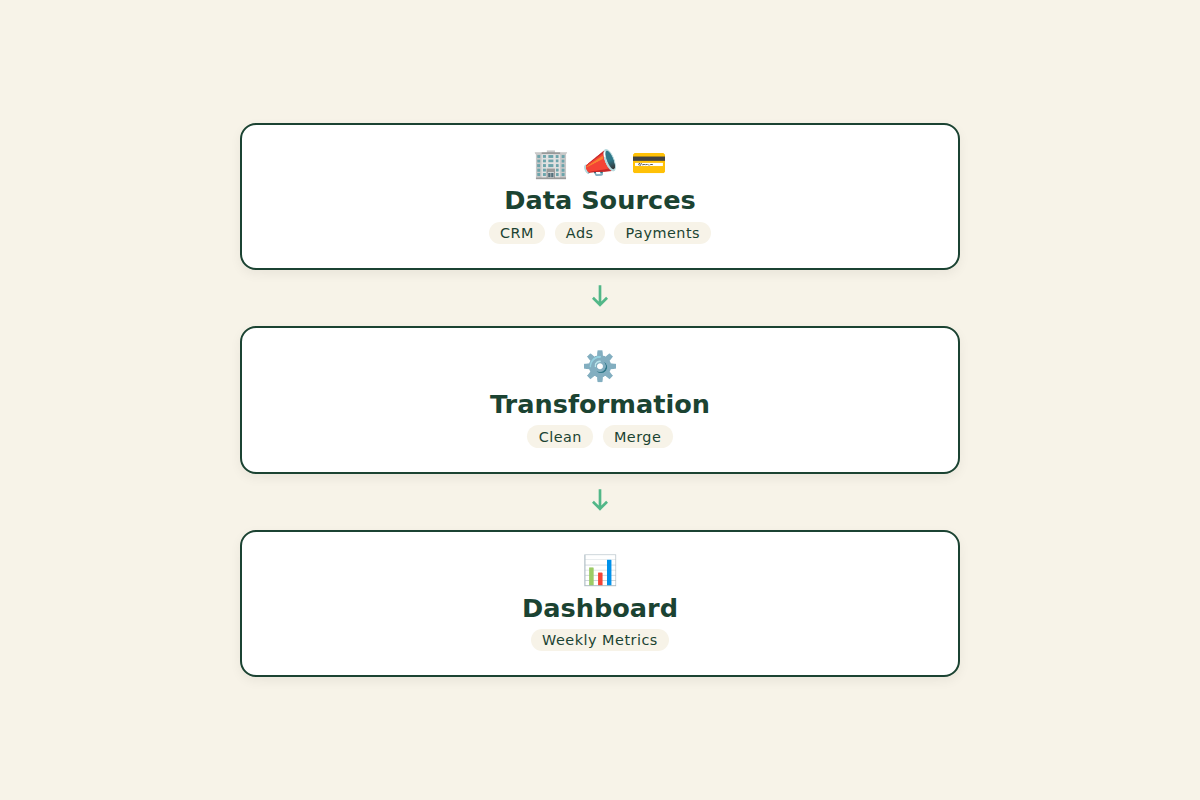
Data democratization for a non-technical founder looks nothing like the enterprise version. You’re not trying to empower dozens of departments; you’re trying to get a single dashboard that tells you whether your marketing spend is actually converting. The architecture is simple: a data source (your e‑commerce platform, CRM, ad accounts), a transformation layer (a few SQL queries or a no‑code connector), and a visualization layer that surfaces the answers you need.
Most of the hype skips the setup reality. You need to connect your tools, define your metrics, and build a clean data model. That’s not a weekend project for someone who’s never touched SQL. But the payoff is real: once the pipeline is live, you stop asking “Can someone pull the numbers?” and start asking “What should we do next?”
The common mistake founders make is trying to replicate a full enterprise stack—looker, dbt, Snowflake—before they’ve even hit $50k MRR. The architecture you need at early stage is radically simpler. Think Google Sheets + a simple BI tool, or a single‑purpose tool like Querio that sits on your raw data and lets you ask questions in plain English. The important thing is that the architecture matches your current size, not your ambitions two years from now.
The Workflow Math
Let’s put numbers on the decision. Assume you’re a founder handling everything yourself, spending about 5 hours per week on manual reporting (pulling from three sources, formatting in Excel, emailing a few numbers to yourself).
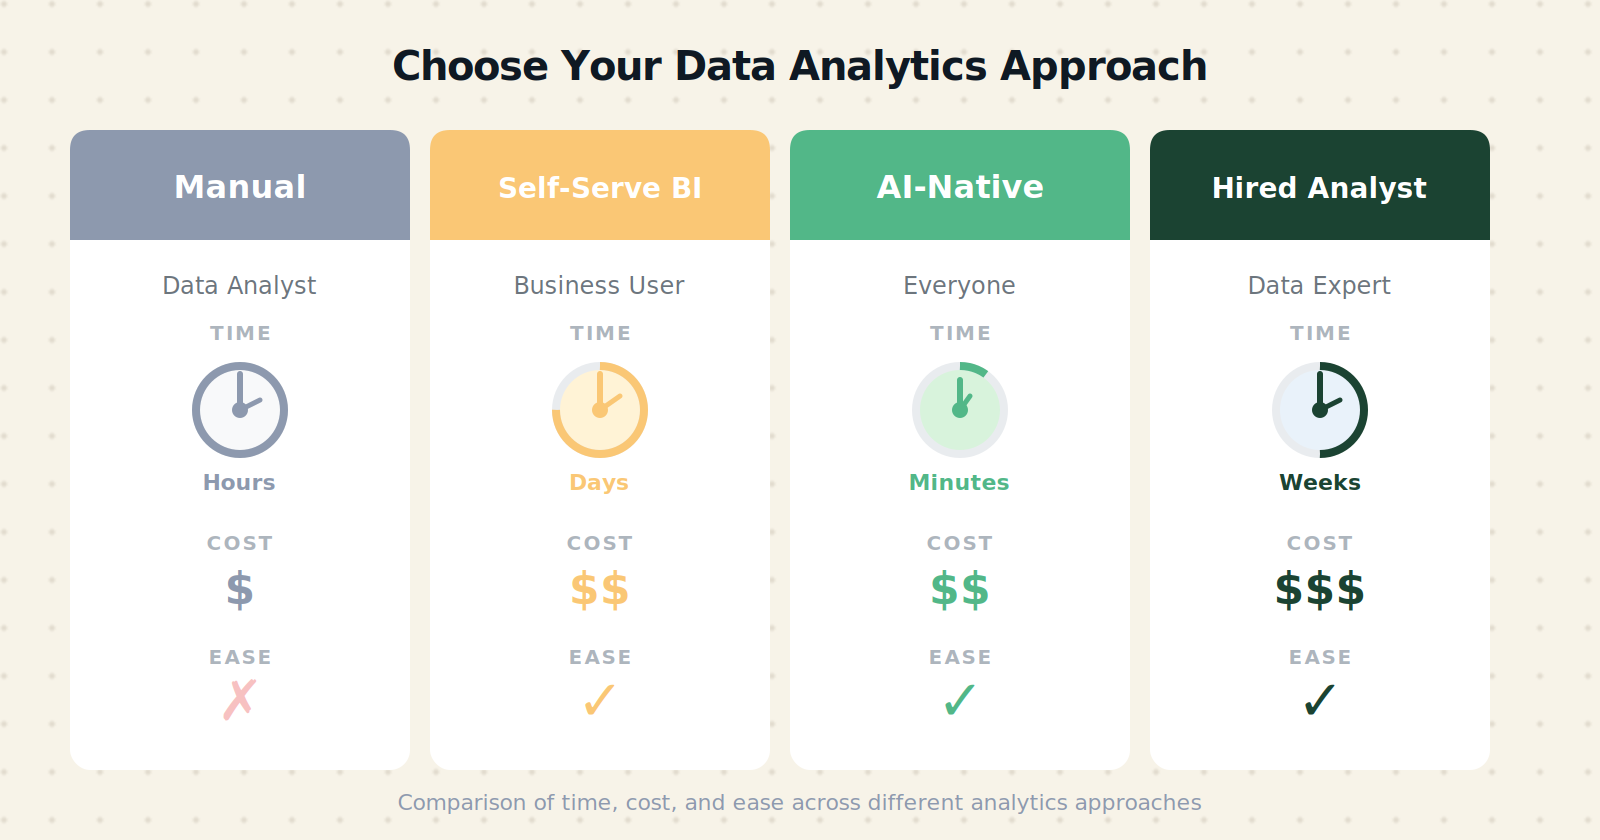
| Approach | Setup Time | Weekly Maintenance | Cost | Time to First Answer |
|---|---|---|---|---|
| Manual spreadsheets | 2 hours initial setup | 5 hours/week | Free (Excel) | Instant (but error‑prone) |
| Self‑serve BI tool (e.g., Metabase, Power BI) | 20–30 hours over two weeks | 2 hours/week (refreshing data) | $0–$100/month | 1–2 weeks after setup |
| AI‑native tool (e.g., Querio, SeekTable) | 10–15 hours over one week | 1 hour/week (monitoring) | $50–$200/month | 3–5 days |
| Hiring a part‑time analyst | 5 hours to brief | 10 hours/week (analyst) | $500–$2,000/month | 1 week for first report |
The math is clear: any form of democratized tooling requires an upfront time investment of 10–30 hours. That’s a week of your life. If you’re surviving on gut decisions and your biggest problem is that you don’t know which customer segment churns fastest, that week is a high‑ROI bet. But if you’re already spending 10 hours a week on manual reporting, switching to a self‑serve tool can free up 8 hours of that time once the setup is complete.
Where It Breaks
For non-technical founders, the brittle points are almost never about the tool’s capabilities. They’re about execution gaps that the marketing pages don’t mention.
1. Data hygiene is your single biggest tax. Every platform generates messy data—duplicate customers, missing fields, inconsistent date formats. If you connect a tool directly to raw source data without cleaning it, your dashboard will look like a treasure map drawn in crayon. The hidden time sink is the cleaning phase, which often takes longer than building the dashboard itself.
2. Over‑engineering kills momentum. It’s tempting to set up a full data warehouse with dbt transformations before you have any dashboard to show. That’s a trap. Start with a single metric that matters most (e.g., weekly revenue), build a dashboard for that, and then add complexity. Founders who try to build the entire data infrastructure at once usually give up after two months.
3. The tool you choose today might not fit tomorrow. As you grow, you’ll need more granularity, more data sources, and better governance. Many founders lock themselves into a tool that cannot handle more than a few gigabytes or that lacks export capabilities. Then they have to redo the entire setup a year later. Choose a tool that supports standard SQL exports or has a robust API, even if you don’t need it yet.
4. You will have to learn a little SQL—or accept limits. Even with natural‑language query tools, there will be questions your dashboard can’t answer, and you’ll need to tweak the underlying queries. If you absolutely refuse to touch SQL, your analytics will be constrained to whatever the tool’s UI offers. That’s a legitimate choice, but it comes with a ceiling.
5. Trust issues. When you’re the one setting up the data pipeline, there’s no one to blame but yourself when numbers don’t match. Misinterpreting metrics (e.g., confusing unique visitors with sessions) leads to bad decisions. You need to personally validate a few reports before you trust the system.

The Friction Box
- Data cleaning takes 3x longer than expected; most tool demos hide this.
- You’ll spend your first 10 hours just connecting sources and defining basic metrics, not analyzing.
- Natural‑language queries are great until they produce a wrong answer; you can’t spot the error without domain logic.
- If you don’t automate refresh, the dashboard becomes stale within days and you’re back to manual pulls.
- The tool ecosystem is fragmented: you might need a separate data extraction tool (e.g., Stitch, Airbyte) plus a BI tool plus a transformation layer—more complexity than a one‑person operation can manage.
Frequently Asked Questions About Democratized Data Analytics for Non-Technical Founders
What is data democratization in simple terms?
Data democratization means giving everyone in an organization—not just data scientists—the ability to access and use data to make decisions. For a non-technical founder, it’s about having a system where you can ask a question like “How many new customers did we get this month?” and get an answer without needing to write complex SQL or rely on someone else.
Do I need to hire a data team to start using data analytics?
No. Many tools now offer natural-language querying and pre-built connectors that let a solo operator get started with minimal technical skill. However, you will need to invest a few hours in setup—setting up data sources, cleaning data, and learning the tool. Hiring becomes necessary only when your data volume grows beyond what a single dashboard can handle.
What’s the cheapest way to get started with data analytics as a founder?
The cheapest route is using Google Sheets connected to a free BI tool like Metabase. You can pull data from your e-commerce platform or CRM using manual exports or free connectors. This costs nothing upfront but requires manual effort to keep data fresh. A step up is a $50–$100/month AI-native tool that automates the connection and cleaning.
How long does it take to see a return on my time investment?
If you spend 20–30 hours setting up a self-serve analytics tool, you’ll typically start saving 1–3 hours per week after the first month. That means the setup pays for itself in 7–10 weeks. But the more important return is qualitative: you make decisions based on real data instead of gut feelings, which reduces risky moves.
What if I make a wrong conclusion from my data?
It happens to everyone. The fix is to start with a single, well-understood metric (like weekly revenue) and validate it against another source (e.g., your bank statement). Once you trust that one number, you can add more. Also, use tools that let you drill down into the underlying data to spot anomalies. If you’re unsure, have a data-savvy friend or freelancer review your initial setup.
Can I use the same tool as a larger company?
Technically yes, but it’s usually overkill and overpriced for a founder. Tools like Power BI or Looker are designed for teams with multiple users and complex governance needs. For a solo founder, a simpler tool like Metabase, Querio, or even Google Data Studio is faster to set up and easier to maintain. You can always upgrade later.
The Straight Talk
If you’re a solo founder or the only person running operations, and you spend more than 3 hours per week manually compiling numbers, data democratization is worth the upfront time—provided you pick a tool that matches your current scale and you commit to learning the basics of data hygiene. Skip the enterprise stacks; start with something that connects directly to your sources and lets you ask questions in English or simple SQL.
This approach is not for you if you’re comfortable with gut‑based decisions and your business doesn’t yet have metrics that matter (e.g., pre‑revenue, still validating product). In that case, your time is better spent talking to customers than building dashboards.
Next concrete action: open Google Sheets, list your three most important metrics, then spend one hour researching exactly one self‑serve analytics tool (try Metabase or Querio’s free tier). Commit to building a single dashboard this week.