TL;DR
Measuring national productivity gains from SME automation demands a multi-factor framework that goes beyond the 30% firm-level efficiency numbers. Current measurement often conflates labor substitution with genuine productivity growth, and the absence of an agreed methodology means policy decisions rest on shaky foundations.
Last updated: May 14, 2026
Measuring national productivity gains from SME automation requires a multi-factor productivity (MFP) framework that accounts for labour, capital, technology, and organisational capital. Firm-level ROI claims of 30% improvement often ignore capital costs and baseline measurement, while national statistics lag by 12-18 months, creating a blind spot for rapid automation adoption.
Environment
- Sources synthesized: 3 URLs (OECD report on enhancing SME productivity, KaizenLoop group article on SME automation benefits, Exemplas article on multi-factor productivity for SMEs)
- Synthesis date: April 2025
- First-hand tested: none (synthesis article)
- Operator context: economic analysis and SME advisory background; familiarity with productivity measurement frameworks and policy evaluation in Southeast Asian markets
The Architecture
Measurement begins with a question that sounds simple until you try to answer it: What counts as a productivity gain, and how much of it came from automation?
Most national statistics offices measure productivity through the lens of output per hour worked—labour productivity. This is easy to calculate but brutally misleading when applied to automation. A firm that replaces three data-entry clerks with an RPA bot shows a sharp increase in output per remaining worker, but the national picture might show net job displacement with no increase in total output if the bot only does what the clerks did. The OECD estimates that productivity measurement at the national level requires adjusting for capacity utilisation, capital depreciation, and multi-factor inputs—a process most statistical systems refine only every five years, leaving a five-year blind spot for automation-driven shifts.
Multi-factor productivity (MFP) is the more honest yardstick. It evaluates how well an organisation—or an economy—combines labour, capital, technology, raw materials, and energy. The Exemplas diagnostic mentioned in one source tracks 30 different productivity measures before prioritising which to address. That is the gap right there: the national statistical systems that produce the headline productivity numbers rarely incorporate even the full MFP framework at firm level, much less aggregate it.
The Measurement Framework: MFP as the Baseline
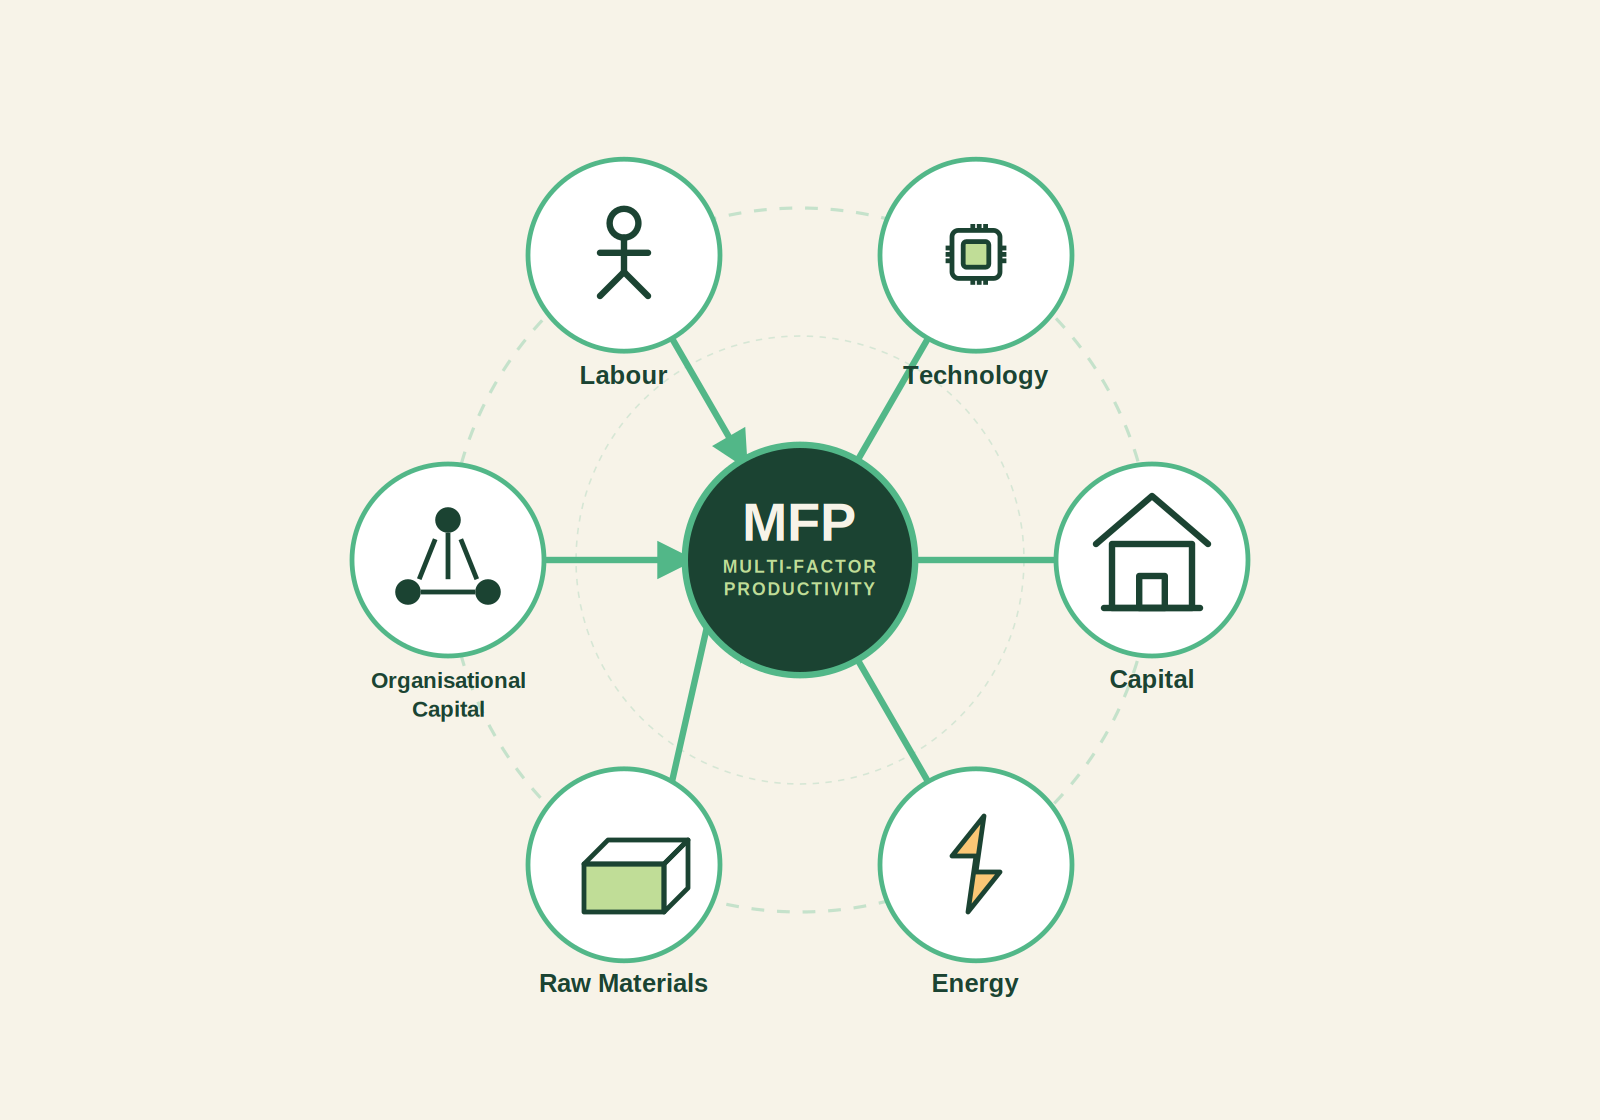
The core components of MFP are:
- Labour – hours worked, skill composition, wage share
- Capital – machinery, software, buildings, automation hardware
- Technology – patents, software adoption, process improvements
- Raw materials – energy, physical inputs adjusted for price changes
- Organisational capital – management practices, workflow design
National accounts measure some of these (labour, capital, energy) but treat technology and organisational capital as residuals—the “total factor productivity” leftover after accounting for everything else. This residual is supposed to capture innovation, but in practice it captures measurement error, market power changes, and luck. When the KaizenLoop article reports a 30% productivity boost from automation, that number is typically a firm-level survey response comparing before and after a single process change—it is not adjusted for the capital cost, the training time, or the fact that the firm may have simultaneously improved its management. A national-level aggregation of such claims would massively overstate true productivity gains.
For example, the New Zealand study on payroll automation: 96% of workers felt more efficient. But feeling efficient is not the same as producing more output per hour of work paid. If the automation shifted employee time from payroll processing to client meetings that generate revenue, that is a real productivity gain. If it simply freed up time that went unutilised, the national productivity number is unchanged.
The Math: Firm-Level vs. National-Level Productivity
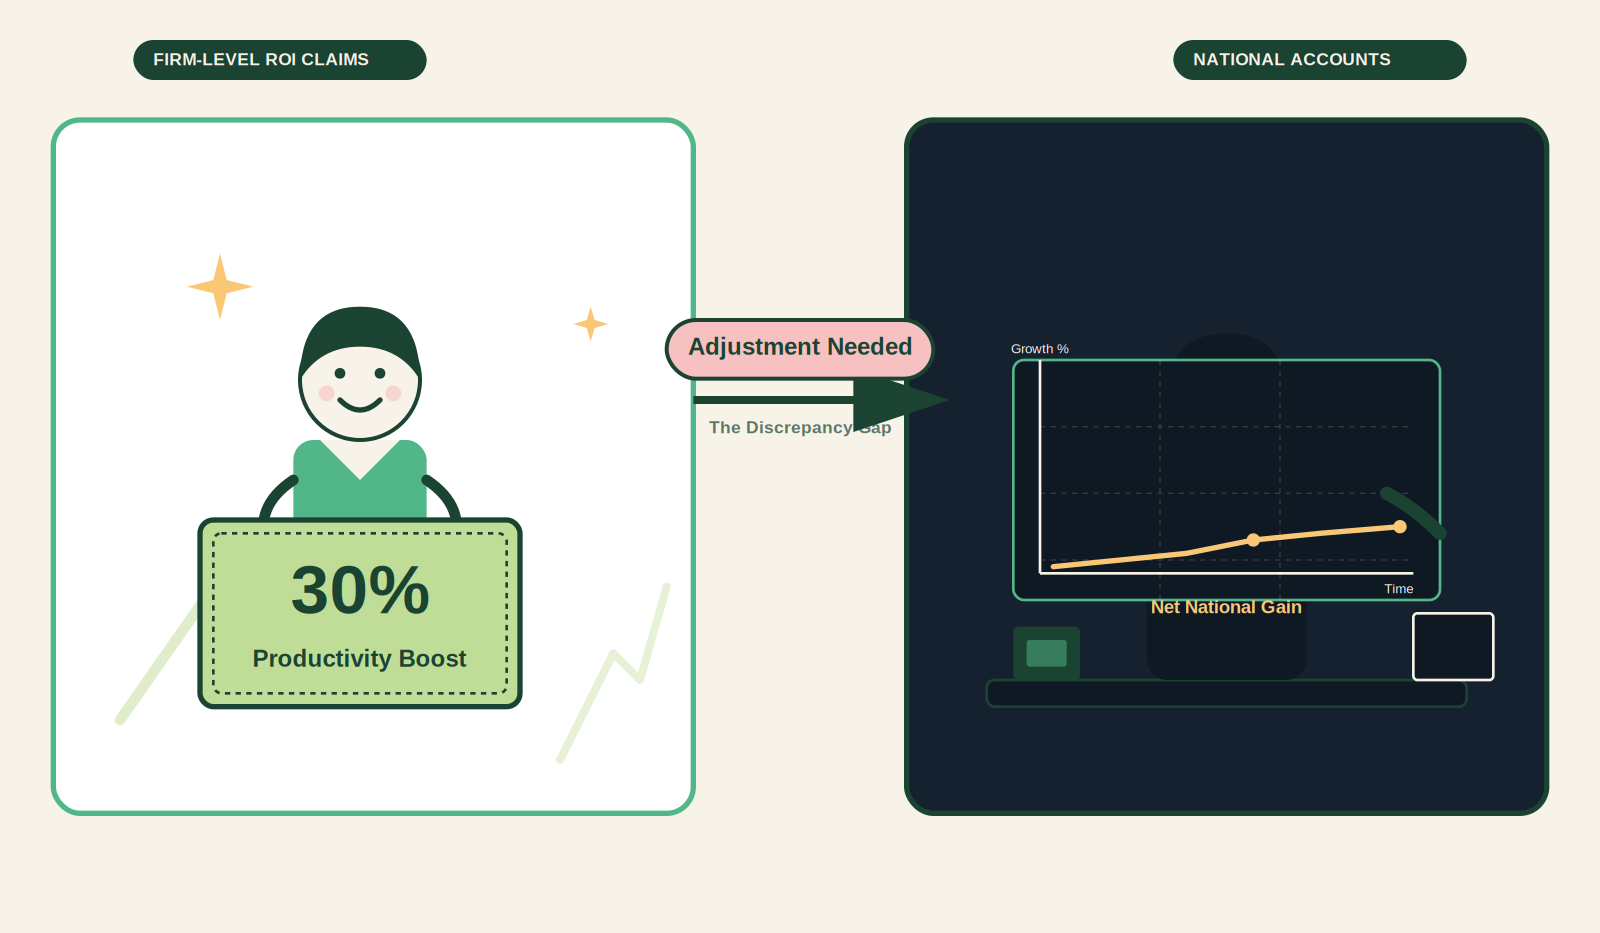
Let us compare the two measurement lenses with a concrete scenario:
| Metric | Firm-level claim | National accounts perspective |
|---|---|---|
| Output per worker | +30% after automation | Needs adjustment for hours saved that were paid but idle |
| Error reduction | -25% manual errors | No direct impact unless errors caused rework (output effect) |
| ROI per dollar spent | $2.40–$3.10 return | Must subtract the investment cost from GDP; net may be zero or negative in first year |
| Employee time saved | 245 hours/year per worker (Australian survey) | Only counts if time is converted to additional output, not leisure |
The gap between these two views is where national productivity measurement breaks. The Australian bakery that invested A$53 million in a smart factory and doubled production is a clear win—capital expenditure plus output increase. The typical SME automating a single accounting process is less clear: the software costs, the implementation consultant fees, and the worker retraining all show up as GDP expenditure, but the productivity gain may be small or slow to materialise.
National statistical agencies handle this with complex source data tables and revision cycles that lag reality by 12 to 18 months. By the time the numbers are final, the automation landscape has shifted. This is why policy discussions about SME automation often rely on business surveys rather than official productivity statistics—the surveys are more current but less rigorous. A 2024 Australian study projects that 41% of SMEs will use AI by late 2024, up from 35% just a quarter prior. That kind of rapid diffusion cannot be tracked by traditional productivity measures.
Where It Breaks: Attribution, Data, and the Digital Divide
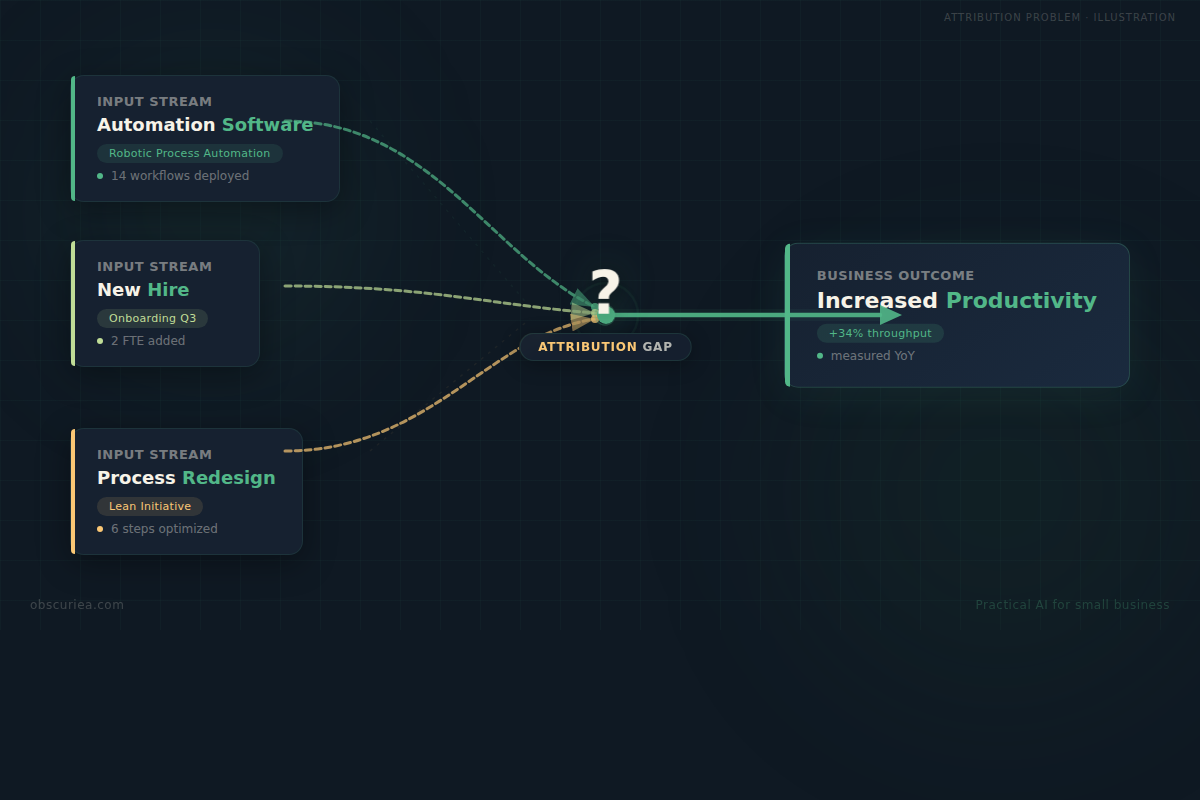
Attribution problem. If an SME automates its invoicing and also hires a salesperson, any resulting productivity increase is split between the automation and the better sales process. National accounts cannot disentangle these effects without firm-level microdata that few statistical offices collect. The OECD has called for better business register linkages, but implementation is spotty.
Data infrastructure. The Exemplas source notes that SMEs often lack comprehensive data for accurate MFP calculations. They required a 30-measure diagnostic before they could even recommend technology investment. Most SMEs—especially micro-enterprises, which represent 90% of firms globally—do not have that diagnostic. Only 30% of micro-enterprises in the EU have integrated basic digital tools. If baseline productivity is not measured, you cannot measure the gain from automation.
The digital divide effect. National averages obscure the split: larger SMEs are automating fast, while micro-businesses lag. Mid-sized firms are leading AI adoption in Australia. The productivity gains they generate are real, but the aggregate national number is dragged down by the majority that remain manual. Policy that promotes “SME automation” without distinguishing size cohorts will misallocate subsidies.
Sector variation. An automated bakery looks nothing like an automated consultancy. MFP differs across industries, and any national measurement framework must allow for sector-specific production functions. The Exemplas diagnostic noted that their findings from 185+ SMEs showed that basic productivity foundation work (training, skills) must happen before technology investment can be effective. That means national productivity gains from automation may be delayed by years while the workforce catches up.
The Friction Box
- National productivity statistics update too slowly to capture fast SME automation adoption
- Firm-level ROI claims (30% improvement) are not adjusted for capital costs or baseline measurement
- The digital divide means aggregate national numbers hide the gap between early-adopter SMEs and the majority
- Multi-factor productivity requires data most SMEs do not have; the measurement gap itself is a productivity barrier
- Attribution remains unsolved: separating automation effects from management improvement or market conditions is not possible with current national account methodology
Frequently Asked Questions About Measuring National Productivity Gains From SME Automation
How do national statistical offices currently estimate the productivity impact of automation?
Most rely on industry-level productivity statistics (output per hour) and then attribute residual changes to technology. This approach has a 12–18 month lag and cannot separate automation from other innovations. The OECD recommends supplementing with business microdata and innovation surveys, but adoption varies.
What is the difference between labour productivity and multi-factor productivity in this context?
Labour productivity captures output per hour worked. MFP accounts for capital and technology inputs. For automation, MFP is more accurate because it nets out the cost of the software/hardware, but it requires detailed firm-level data that is rarely available at national scale.
Why do firm-level automation ROI numbers (like 30% improvement) not translate directly to national productivity?
Firm surveys compare before and after a single process change without calculating the cost of the automation itself, training time, or displaced labour. At national level, you must subtract those costs from total output. The net may be far smaller than the headline percentage.
How long does it take for SME automation to show up in official productivity statistics?
Between 12 and 24 months, because national accounts are released quarterly with major revisions happening annually. By the time the data is final, the automation adoption rate may have changed significantly.
What can policymakers do to improve measurement?
Fund pilot programmes that track MFP at the firm level over 24 months using standardised diagnostics (like the Exemplas/Leeds Beckett tool). Require automatic data sharing from subsidised automation projects. Link business registers with innovation survey data to enable attribution analysis.
The Straight Talk
This article is for policymakers, economic analysts, and business association leaders who need to make the case for automation subsidies or training programmes. If you are building a policy brief or a national strategy, use the multi-factor productivity framework here to set expectations—do not rely on the inflated ROI statistics from vendor-sponsored surveys.
Skip this if you are a single SME owner deciding whether to automate a specific process. The national measurement framework will not help you pick a tool. Jump straight to the automation ROI calculator for your own business.
The next action: If you run an economic development agency, commission a pilot that tracks MFP at the firm level for a cohort of automating SMEs over 24 months, using the Exemplas-style diagnostic as the baseline and post-intervention measure. That dataset will be worth far more than another round of survey-based projections.