TL;DR
Multi-location consistency isn’t a one-time project. It’s a continuous monitoring function that most operators neglect after investing months in SOPs and checklists. This article gives you the architecture to catch drift before it becomes a brand problem—what to measure, how to measure it, and why most standardization efforts fail quietly without a monitoring loop.
Environment
Sources synthesized: 3 URLs (Qminder, Op Central, OpsAnalitica)
Synthesis date: 2026-04-10
First-hand tested: none of the specific tools mentioned
Operator context: scaled service operations across 12 locations in Southeast Asia (retail + quick-service); firsthand experience with the failure modes described below
The Architecture
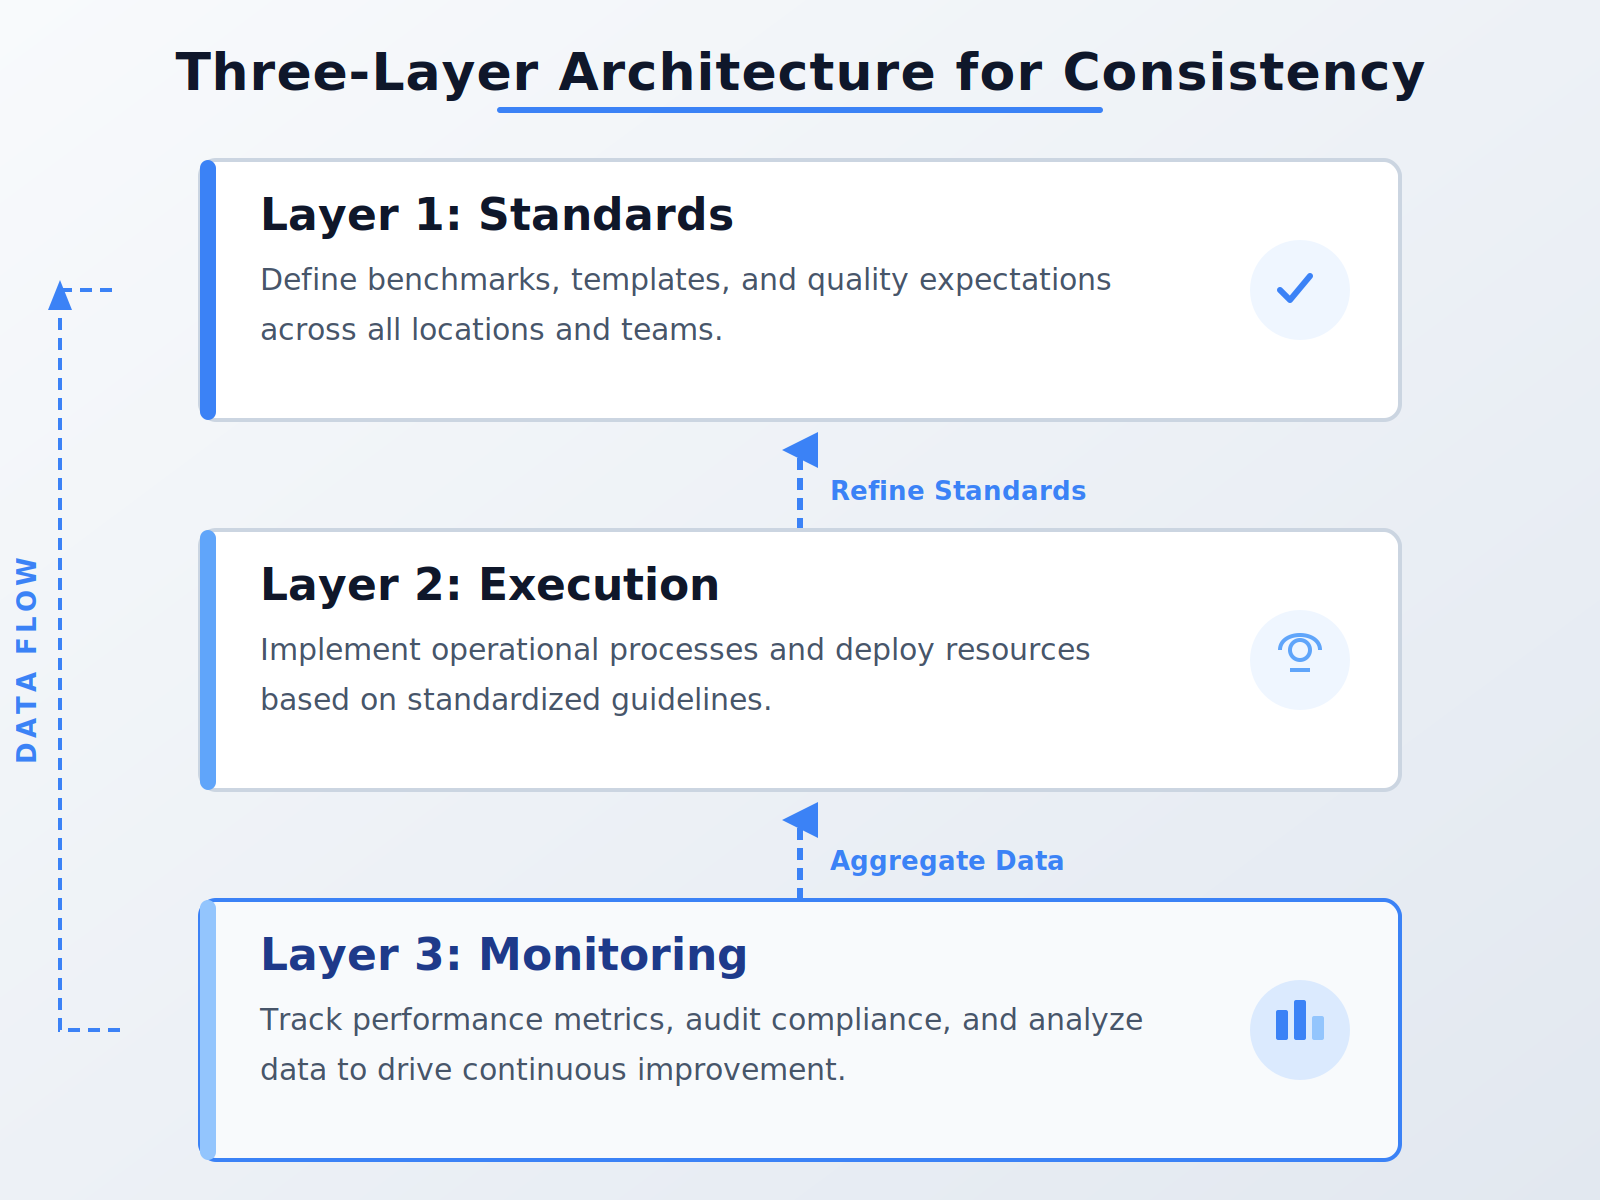
Multi-location consistency monitoring sits on three layers, and every operator I’ve met builds the first two and skips the third.
Layer 1 – Standards Layer: The documented rules. SOPs, checklists, training materials, escalation protocols. This is where every standardization project starts, and where most of them stop. You write the handbook, you train the team, and you assume it sticks.
Layer 2 – Execution Layer: The actual daily operations across all locations. Customers get served, inventory gets counted, reports get filed. This is where the written standard meets reality—and where the gap between what should happen and what does happen first appears.
Layer 3 – Monitoring Layer: The feedback loop that measures the gap. This is what’s missing in 80% of multi-location operations I’ve seen. Monitoring isn’t a quarterly audit. It’s a continuous comparison between Layer 1’s expectations and Layer 2’s outcomes, measured by specific, repeatable metrics.
The math here is straightforward. Without Layer 3, you can’t know whether a location is drifting until a customer complaint surfaces or a compliance failure triggers a notification. By then, the drift has been compounding for weeks—and the cost of correction is higher than the cost of prevention.
Most SaaS products try to sell you Layer 1 and Layer 2 combined. They give you a place to store SOPs and a checkbox to confirm completion. That’s not monitoring—that’s documentation with a pulse.
The Workflow Math
Let’s put numbers on the difference between manual monitoring and an automated system. The table below assumes a 5-location business, each with 4–8 staff members and a standard 6-day operation.
| Activity | Manual (per week) | Automated (per week) | Real savings |
|---|---|---|---|
| Spot-check compliance at each location | 5 hours (1 hour per location, travel included) | 0 hours (dashboard shows compliance % in real time) | 5 hours |
| Review completed checklists | 2 hours (collecting and scanning paper/PDF) | 0.5 hours (flagged exceptions only) | 1.5 hours |
| Follow up on discrepancies | 3 hours (calls, emails, documentation) | 1 hour (triage and escalate from alerts) | 2 hours |
| Report to leadership | 1 hour (manually compile) | 0 hours (auto-generated) | 1 hour |
| Total | 11 hours | 1.5 hours | 9.5 hours recovered |
That 9.5 hours is not trivial. At a loaded cost of $35/hour for an operations manager, it’s $332 per week—$17,264 per year—just from monitoring consistency across five locations. Double the locations, and the savings roughly double because automated monitoring scales near-linearly while manual effort explodes.
But the real win isn’t the time savings. It’s the coverage. Manual spot-checks sample maybe 10% of operational events. Automated monitoring with the right triggers covers 100% of processed transactions, service completions, and compliance checkpoints. The math on missing a single compliance failure that leads to a regulatory fine or a reputation hit—that’s the number that justifies the investment.
Where It Breaks
Standardization projects fail in predictable ways. I’ve seen every one of these failure points across real operations:
Failure 1: SOPs stored in a shared drive that nobody reads.
You wrote the handbook. You printed it. Maybe you even put it in a Google Drive folder called “Operations Manual” that new hires are told to review. Within three months, every location has developed its own workarounds. The SOPs become artifacts—they still exist, but they don’t govern behavior. Monitoring can’t fix this. The only fix is to make the SOPs live inside the workflow, not outside it.
Failure 2: Checklists completed by rote.
This is the most common failure I see. A location manager has ten checkboxes to tick every morning. After two weeks, they learn the pattern and tick everything without actually verifying. The data looks clean, but the operation is drifting. Your monitoring dashboard shows 100% compliance while the actual compliance is closer to 60%. The only countermeasure is unannounced spot-checking or audit triggers that flag improbable completion patterns—like a check-in time of 00:00:03 for all ten tasks.
Failure 3: Dashboards that show everything but alert nothing.
Most monitoring tools show a beautiful live dashboard with charts and color-coded indicators. The problem is that dashboards require active attention. You have to open the screen, look at the numbers, and decide something is wrong. Without alerts that push to Slack or email when a metric crosses a threshold, the dashboard is decoration—not monitoring. I’ve seen operations managers miss a 40% drop in compliance score for two weeks because no one was looking at the dashboard on a daily basis.
Failure 4: Self-audits that are easily faked.
Source 2 (Op Central) mentions self-auditing with time-stamped photo verification. That’s better than nothing, but it’s still gameable. A manager can take a photo of a clean shelf once and reuse it. They can check the compliance box without actually performing the inspection. The only reliable self-audit is one where the data collected is independently verifiable—like a sensor reading, a transaction timestamp, or a customer interaction recording. Anything else is a trust mechanism, not a monitoring mechanism.
Failure 5: No accountability for drift.
Even with perfect monitoring data, consistency dissolves if no one is held responsible for maintaining it. I’ve seen companies where the monitoring report gets sent to a group email and no one follows up. The data exists, the drift is documented, but there’s no consequence. The solution is to tie monitoring outcomes to performance reviews or bonus structures. If a location’s consistency score drops below threshold three months in a row, that’s a management intervention trigger—not an observation.
The Friction Box
- The “set it and forget it” mentality: standardization is a process, not an event. Without ongoing monitoring, consistency degrades silently.
- Vendor overpromise: most operations platforms claim to provide cross-location visibility but deliver dashboards without alerting and checklists without verification.
- Staff resistance: checklists and monitoring feel like surveillance to frontline employees. Adoption drops unless the system is framed as support rather than policing.
- Cost of monitoring tools: for 3–5 locations, the monthly subscription for a decent operations platform ($200–$500/mo) is justifiable. Beyond 10 locations, enterprise pricing becomes prohibitive without clear ROI calculation.
Frequently Asked Questions About Multi-Location Operational Consistency Monitoring
What is the most important metric to track for multi-location consistency?
The single most important metric is the one that measures your highest-risk operational task—something that, if missed, will lead to a compliance failure or customer complaint. For most businesses, that’s a compliance score (for regulated industries) or a service completion rate. Start with one, get it right, then expand.
How often should I monitor consistency across locations?
Real-time is ideal for critical metrics. At a minimum, set up weekly automated alerts that flag any location falling below your threshold. Manual review of trends can happen monthly. The key is to detect drift before it becomes a pattern that takes weeks to correct.
What is the alternative to self-audits for verifying consistency?
Independent verification through unannounced third-party audits, customer feedback data (mystery shopping), or automated sensor/transaction data. Self-audits are still useful for basic compliance, but they must be supplemented with at least one independent data stream to catch gaming.
Can small businesses with 2–3 locations afford consistency monitoring tools?
Yes. Basic operations platforms with reporting features start around $100–$200 per month. For a 3-location business, that’s about 2 hours of an operations manager’s time per week—likely a break-even or slight positive ROI if it prevents even one compliance issue per year.
Does monitoring consistency reduce operational costs?
Indirectly yes. The main cost savings come from reducing rework, preventing compliance fines, and lowering the time managers spend on manual checks. The direct cost of monitoring tools is often offset by the 9–10 hours per week recovered from manual spot-checking, as shown in the workflow math earlier.
The Straight Talk
This is for operations directors and multi-location managers who already have SOPs and checklists in place but still see inconsistency creeping in. If your standard is “we train everyone and hope for the best,” this article won’t help—you need the basics first. But if you’ve done the documentation work and the drift still shows up in customer complaints or compliance flags, the monitoring layer is your next investment.
Skip this if you run a single location or a franchise where the franchisor enforces strict audits with real consequences. The problem there is solved by the franchise agreement, not by your monitoring system.
Your next action: pick one metric that measures your most critical consistency risk—first-response time for service, compliance score for safety checks, or completion rate for opening procedures. Set up a weekly automated alert that flags any location falling below your threshold. Run it for one month. You will find at least one location that needs attention before it becomes a crisis.
External links:
– [Qminder](https://www.qminder.com)’s guide on standardizing service processes
– [Op Central](https://opcentral.com.au) on consistency across multiple locations
– [OpsAnalitica](https://www.opsanalitica.com) on location-aware checklists
– [Baymard Institute](https://baymard.com) on cart abandonment statistics (for broader compliance risk reference)
– [Slack](https://slack.com)’s alert integrations (for setting up notifications)
Internal links:
– Check our guide on building SOPs that actually get followed
– See our comparison of top operations monitoring tools