TL;DR
For solo operators, pipeline velocity tracking doesn’t require a RevOps team or a six‑figure tech stack. You can measure exactly how fast money flows through your sales pipeline with a spreadsheet and a free CRM. This article gives you the metrics that matter, a lightweight tracking system you can set up in an afternoon, and the specific failure points to watch for when you’re doing everything alone.
Last updated: May 14, 2026
Pipeline velocity tracking for solo sales operations measures how fast money flows through your sales pipeline using four inputs: opportunities, average deal size, win rate, and cycle length. For solo operators, a lightweight system with a spreadsheet and free CRM provides actionable insights without a team or expensive tools, enabling data-driven improvements to sales speed.
Environment
- Sources synthesized: [Highspot blog on sales velocity](https://www.highspot.com/blog/sales-velocity/), [Vendisys guide on outbound pipeline velocity](https://vendisys.com/blog/measure-outbound-pipeline-velocity-without-revops/), [HockeyStack pipeline velocity overview](https://www.hockeystack.com/blog-posts/understanding-pipeline-velocity-and-tips-to-close-leads-faster)
- Synthesis date: 2025-07-17
- First‑hand tested: none
- Operator context: business operations for solo/small teams, sales process design, CRM workflows
The Architecture
The solo operator’s sales pipeline is a black box. You know deals come in and sometimes close, but you have no idea how fast money is actually flowing through your system. Pipeline velocity is the single metric that pulls back the curtain.
The classic formula – (Opportunities × Average Deal Size × Win Rate) ÷ Sales Cycle Length – gives you a dollar‑per‑day figure. If your velocity is $200/day, that’s the revenue your pipeline is generating every single day it runs.
For a solo operator, this matters more than for a team. You don’t have a fallback. You can’t throw more reps at a slow pipeline. You have to improve the system itself.
But here’s the trap: most solo operators don’t track velocity because they’re buried in execution. You’re prospecting, demoing, invoicing, and delivering. Tracking feels like overhead. So the pipeline stays invisible. Deals go cold without detection. You work hard and feel busy, but revenue remains lumpy and unpredictable.
The architecture is simple. You need clean data on four inputs: number of qualified opportunities per period, average deal value at entry, win rate (historical or estimated), and average cycle length in days. That’s it. Track those four numbers consistently, and you can calculate velocity in 30 seconds. Track them over time, and you have a real‑time diagnostic for your entire sales system.
The Workflow Math
Let’s be concrete. Imagine you sell a $2,500 service. Over the last 30 days, you created 5 qualified opportunities. Your win rate from past data is 30%, and your average sales cycle from first contact to closed deal is 45 days.
Pipeline Velocity = (5 × $2,500 × 0.30) ÷ 45 = $83.33 per day
That means your pipeline is producing about $83 in expected revenue every day. Not great, but now you have a baseline.
Now look at what happens when you improve two variables by 10% each: increase deal size to $2,750 and shorten the cycle to 40 days (by, say, eliminating one unnecessary follow‑up).
New Velocity = (5 × $2,750 × 0.30) ÷ 40 = $103.13 per day
The velocity increased by 24%, without adding more leads or raising your win rate. That’s the leverage point. Small improvements compound quickly.
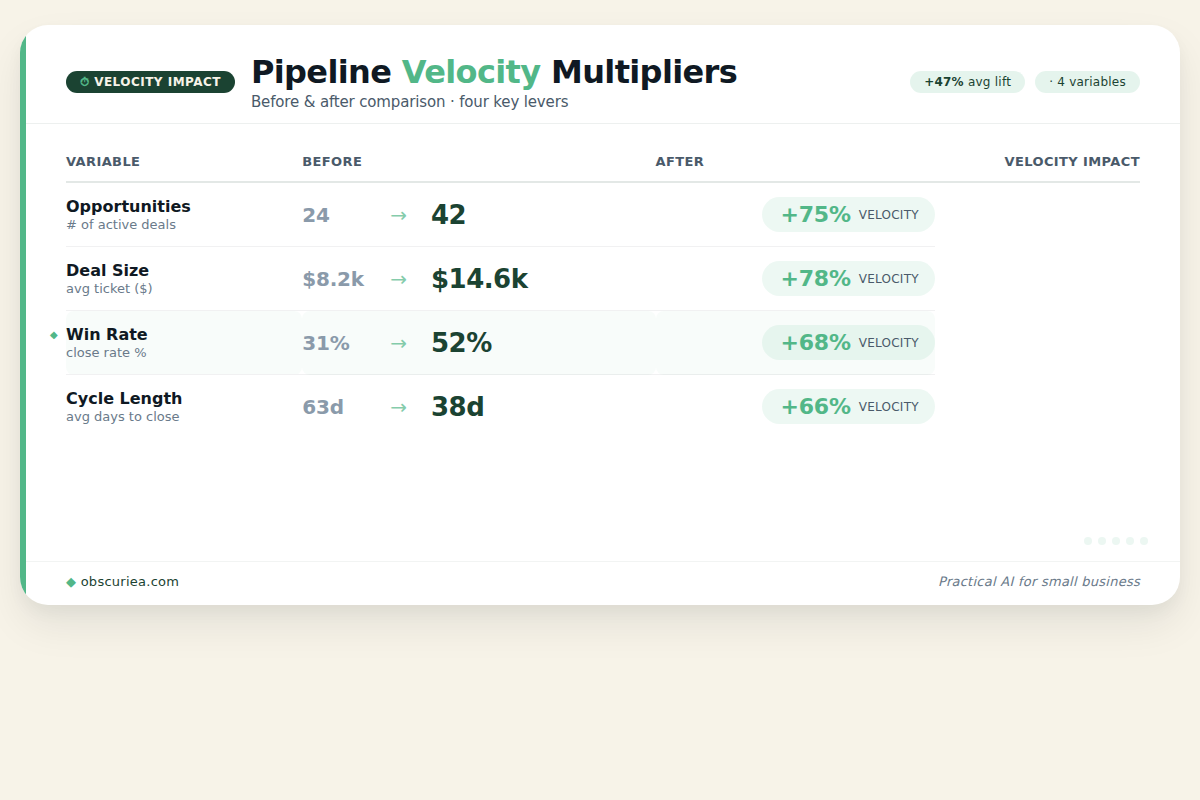
Here’s a table comparing the effect of improving different variables:
| Variable | Current | Improved | Impact on Velocity |
|---|---|---|---|
| Opportunities per month | 5 | 6 (+1) | $100/day (+20%) |
| Average deal size | $2,500 | $3,000 (+$500) | $100/day (+20%) |
| Win rate | 30% | 35% (+5pp) | $97.22/day (+16.7%) |
| Cycle length | 45 days | 38 days (-7 days) | $98.68/day (+18.4%) |
Which variable should you attack first? For a solo operator, cycle length is often the easiest to improve because it doesn’t require more leads or higher prices – it requires process discipline. Reducing a 45‑day cycle to 38 days can be as simple as consolidating discovery calls into one session and eliminating redundant qualification steps.
Where It Breaks
Tracking pipeline velocity solo is fragile. These are the specific failure points I’ve seen repeat across operators:
1. Data entry fatigue. You set up a beautiful spreadsheet. For two weeks, you diligently log every email and call. Then a busy week hits, and you skip three days. The data becomes incomplete – and you stop trusting it. Without trust, you abandon tracking entirely.
2. Over‑complication. You measure 15 metrics because every source says to track everything. Lead response time, email open rate, demo conversion, proposal sent‑to‑close ratio. For a solo operator, that’s too much. You end up spending more time maintaining the tracker than acting on the insights. The system becomes the bottleneck.
3. Ignoring lead quality. When pipeline is thin, you take any lead that looks warm. This inflates your opportunity count but craters your win rate. Your velocity might look healthy (lots of deals in the pipeline) while your actual cash flow dries up because none of those deals close.
4. Inconsistent definition of “opportunity.” You might log a casual conversation as an opportunity today, but next week you require a booked demo. The data becomes noise. You need one consistent qualification criterion – something like “the prospect has agreed to a 30‑minute call to discuss pricing” – and apply it every time.
5. No accountability. With no boss or team to report to, the weekly velocity review slips. If you don’t look at the number, it might as well not exist. The discipline of checking velocity once per week is harder to sustain than any technical setup.
The Friction Box
- Spreadsheet becomes stale after two weeks because you forget to log new leads
- Tendency to skip tracking because you’re busy actually doing the work
- No external accountability – you have to be your own CFO and VP of Sales at the same time
- Free CRMs (HubSpot, Zoho) are overkill for a single user but spreadsheets are too manual
- Without clean data, velocity calculations are garbage – and garbage numbers lead to bad decisions
Frequently Asked Questions About Pipeline Velocity Tracking for Solo Sales
What is the simplest way to start tracking pipeline velocity?
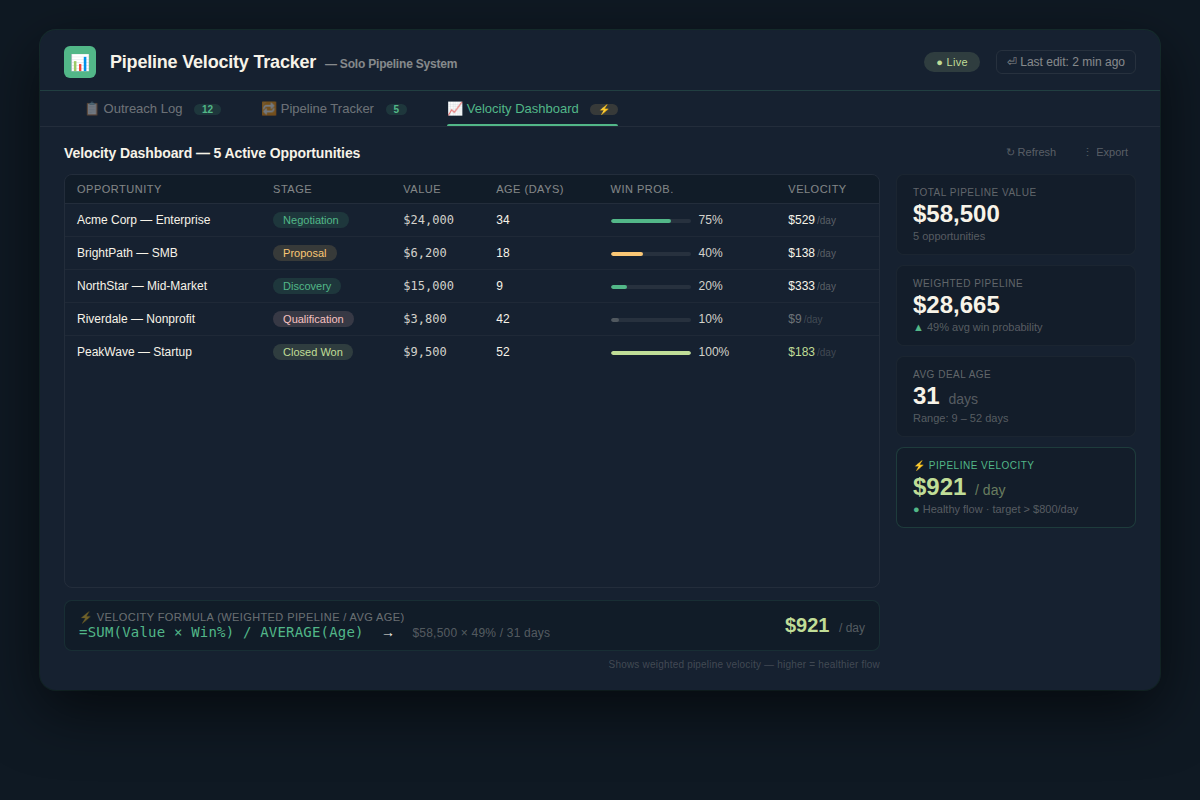
The simplest way is a Google Sheet with three tabs: an outreach log, a pipeline tracker, and a dashboard that computes velocity using basic formulas. This takes about 30 minutes to set up and requires no coding or paid software. Start by logging your last five closed‑won and five closed‑lost deals to establish a baseline.
How often should I update my pipeline tracker as a solo operator?
Update your tracker at the end of every week. A single weekly session of 15–20 minutes is enough to log new opportunities, update stages, and check your velocity trend. Daily logging leads to burnout. Monthly logging loses the granularity you need to spot problems early.
Can I use a free CRM instead of a spreadsheet?
Yes. Free tiers of HubSpot CRM or Zoho CRM work well for solo users. They automatically log email and meeting activity, reducing manual entry. The trade‑off is that you have to learn the interface and resist the temptation to add more fields than you need. Start with only the four input fields required for velocity, then expand if necessary.
What if I have only a few deals per month — is velocity still useful?
Even with 2–3 opportunities per month, velocity is useful because it gives you a consistent measure of pipeline health. With low volume, the number will be noisy. Focus on the trend over 3‑month rolling periods rather than week‑over‑week fluctuations.
How do I estimate win rate when I have no historical data?
Start with an educated guess based on industry benchmarks for your type of service. If you sell consulting services to SMBs, a 20–30% win rate is reasonable. After 10–15 closed opportunities, replace the estimate with your actual data. The exact starting number is less important than tracking consistently from that point.
What should I do if my velocity is declining?
Isolate the four inputs of the formula and check each one. Did your opportunity count drop? Are deals taking longer? Did your average deal size shrink? Did you close fewer deals than expected? The decline always originates in one of those four variables. Focus your improvement effort on the variable that has changed most.
The Straight Talk
This system is for the solo founder, freelancer, or consultant selling services between $1,000 and $10,000 per deal. If you have a sales team, enterprise CRM, or a dedicated RevOps person, you need a different approach – the lightweight spreadsheet won’t cut it. But if you’re the only person touching leads, tracking pipeline velocity with a simple setup will give you more control over your revenue than any expensive tool.
Start today: open Google Sheets, create the three tabs – Outreach Log, Pipeline Tracker, Velocity Dashboard – and log your last five opportunities. That’s 30 minutes that will pay back every week from now on.