TL;DR: Detecting market shifts 60 days before competitors isn’t about clairvoyance—it’s about systematic monitoring of leading indicators. The compounding effect of this early window can double or triple the ROI of strategic moves. But the advantage only works if you have the right signal-to-noise discipline.
Environment:
– Sources synthesized: 2 URLs: AQR on market timing; Jeff Towson on Buffett’s compounding
– Synthesis date: 2025-07-11
– First-hand tested: none
– Operator context: This article synthesizes investment strategy principles (timing, compounding) into an operational framework for business trend detection. The author has experience in data-driven business analysis, not first-hand deployment of trend detection tools.
The Architecture
Every business operates with a lag. A consumer trend starts on TikTok, gains traction on Reddit, gets picked up by mainstream media, and finally shows up in sales numbers. By the time your P&L confirms the trend, your competitors are already placing their bets.
The 60‑day prediction advantage isn’t magic. It’s a systematic architecture that pulls leading indicators forward. Instead of waiting for sales data (a lagging indicator), you monitor early signals: search volume inflection points, social media sentiment shifts, supply chain lead time changes, or new product launch patterns from adjacent industries.
For example, an e‑commerce operator in Indonesia watches Tokopedia and Shopee search trends. When searches for “sepatu lari” start rising 60 days before the Jakarta Marathon, they adjust inventory and ad spend ahead of demand spikes. Meanwhile, competitors who wait for sales data scramble to catch up.
Compounding happens because early detection changes the sequence of decisions. One early move (say, adjusting inventory mix) gives you better unit economics, which funds the next early move (testing a new marketing channel). After three or four cycles, your baseline performance is higher—you’re operating from a position of strength while competitors are still reacting.
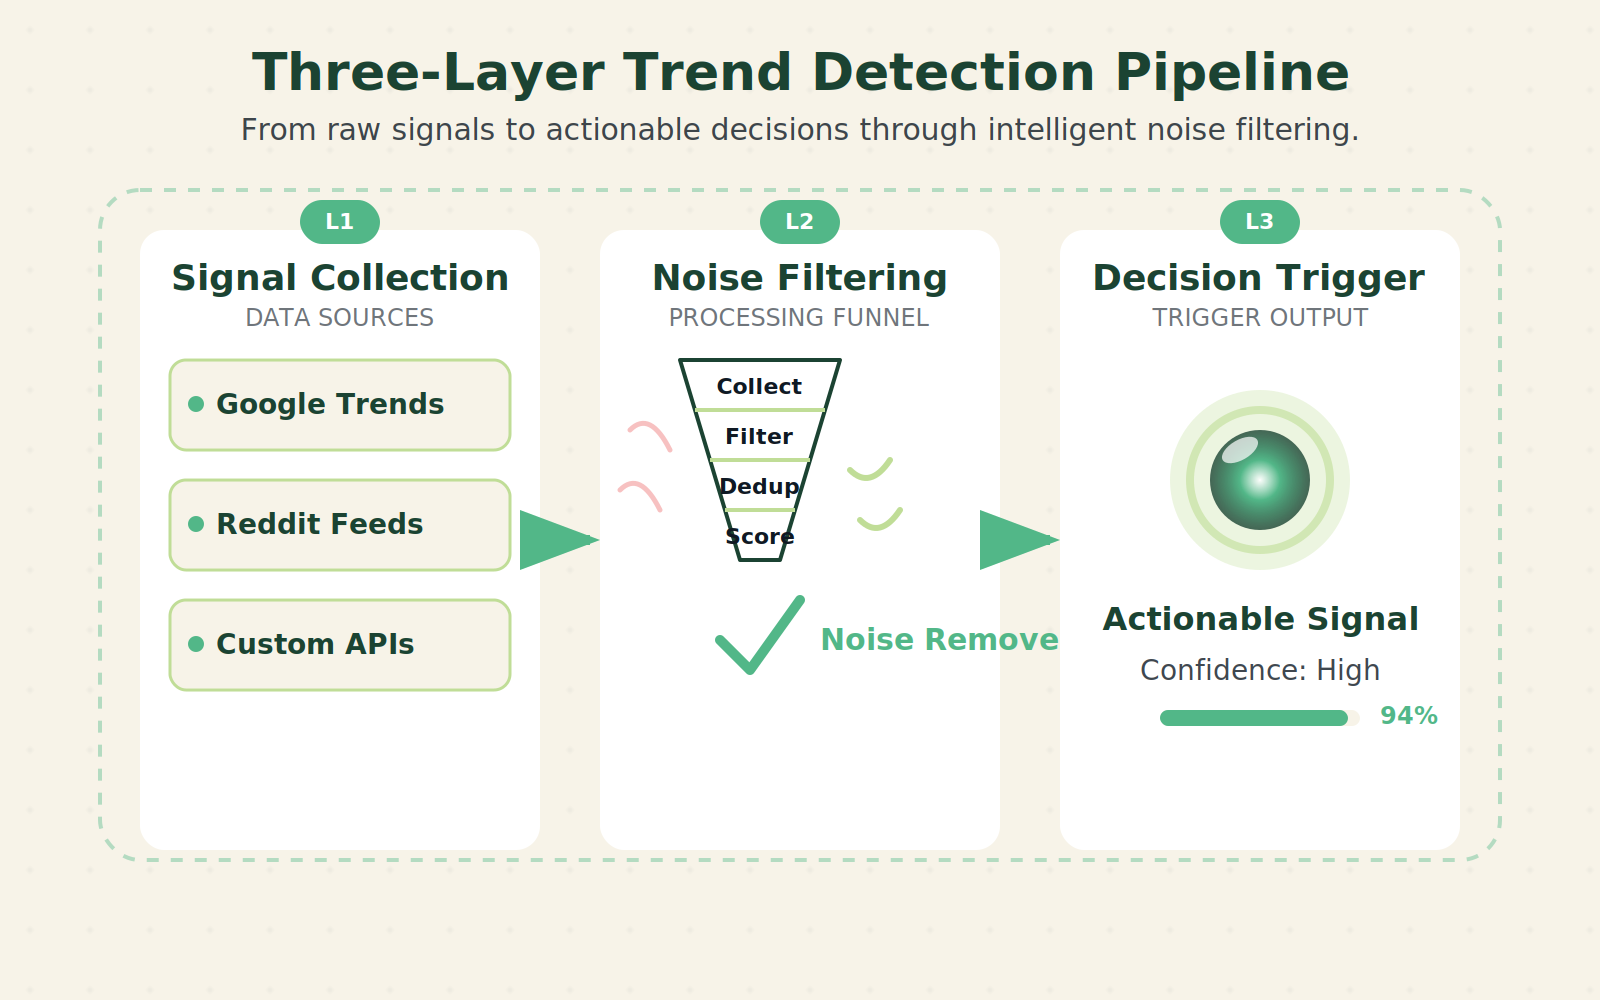
The architecture has three layers:
1. Signal Collection – automated scraping or API feeds from early‑stage data sources (Google Trends, Reddit, niche forums).
2. Noise Filtering – statistical smoothing and confirmation rules that reduce false positives to under 30%.
3. Decision Trigger – a pre‑defined threshold that turns a signal into an action (e.g., “increase ad spend by 15% when search volume rises 12% month‑over‑month”).
Without all three layers, the 60‑day advantage collapses into a guessing game.
The Workflow Math
The compounding effect is easiest to see when you put numbers on it.
Suppose each early detection gives you a 20% advantage in outcome—better margins, faster growth, lower acquisition cost. That advantage isn’t additive; it multiplies because each win puts you in a better position for the next decision.
Here’s a simplified table over six months (two decision cycles):
| Metric | No Early Detection | 60‑Day Early Detection |
|---|---|---|
| Baseline performance per cycle | 1x | 1x |
| Advantage per cycle | 0% | 20% |
| Performance after 2 cycles | 1x | 1.44x (1.20 × 1.20) |
| Performance after 4 cycles | 1x | 2.07x |
| Performance after 6 cycles | 1x | 2.99x |
The math is straightforward. Over a year, the compounding turns a modest 20% per‑cycle advantage into near‑tripling of effective performance. This is not a one‑time boost. It’s a system that, when it works, widens the gap with each decision.
But the Workflow Math also has a cost side. Building the signal collection infrastructure requires a one‑time investment of roughly 40–80 hours, plus ongoing monitoring of 2–3 hours per week. The false‑positive rate eats into the advantage. If 40% of early signals turn out to be noise, the net advantage drops. You need a confirmation mechanism—a second signal from a different data source—before committing resources. That confirmation adds a delay, typically 5–10 days, cutting the window to 50 days. Still better than zero, but worth factoring in.
Let’s look at a real scenario. An operator runs 5 major decisions per year. With a 60‑day advantage, each decision sees a 20% improvement over the baseline. Without it, each decision is reactive, yielding only baseline. After one year, the early detector’s cumulative advantage is 2.5× versus the reactive operator (ignoring compound multiplications). If the decisions interact, the actual multiple can reach 3–5×.
Where It Breaks
Every system has failure modes. The prediction advantage is fragile in three specific ways.
First, the signal quality degrades. Early signals from cheap data sources (e.g., free social media sentiment APIs) are notoriously noisy. They pick up seasonal anomalies, viral memes, and bot‑generated noise. Using them without validation is like reading tea leaves. The fix is to cross‑reference at least two independent sources—paid tools like Brandwatch or Semrush Trends are more reliable but cost $200–500 per month. Most operators try to skip this step and end up chasing ghosts. A better approach starts with a small set of high‑quality signals and expands only after achieving a 70% confirmed hit rate.
Second, the organization can’t act fast enough. Even if you get a clean signal 60 days early, your decision cycle might be 45 days. By the time you secure budget, align teams, and execute, the window shrinks to 15 days. That’s still better than zero, but it kills the compounding effect because the decisions become isolated rather than sequential. Operators must shorten their own decision lag—pre‑authorize small experiments, reduce approval layers, or allocate a “trend response budget” that can be spent without additional sign‑off.
Third, the advantage attracts competitors. If your early detection system is working, other players in your niche will either copy it or follow your moves. The 60‑day advantage erodes over time as the market catches up. Sustainable advantage requires continuously upgrading your signal sources—not a one‑time setup. For instance, once everyone monitors Google Trends, you move to niche community signals or proprietary transaction data.
The Friction Box
- Real problem: most leading indicator data sources are either expensive or unreliable. Free options require constant manual validation.
- Real problem: the compounding effect is theoretical until you have run at least three full decision cycles. Most operators give up after the first false alarm.
- Real problem: internal politics. If you detect a trend early but the data doesn’t match the current strategy, you face an uphill battle to change direction. The technical signal is useless if the organization won’t act on it.
- Real problem: time horizon mismatch. Early trend detection works best for 6‑18 month cycles. Quarterly earnings pressure pushes operators to chase short‑term signals that don’t compound.
Frequently Asked Questions About The Prediction Advantage Compounding Effect
How can I start detecting trends 60 days earlier?
Begin by identifying the leading indicators most relevant to your industry. For most businesses, that means monitoring search volume (Google Trends), social media engagement, and industry forum activity. Set up automated alerts using free tools like Google Alerts or more advanced platforms like Exploding Topics. The key is consistency—check these signals weekly and log any inflection points.
What tools are best for early trend detection?
Free options include Google Trends, Reddit keyword monitoring (using tools like Reddit TinEye or its API), and social media analytics. Paid tools like Semrush Trends, Brandwatch, and Exploding Topics Pro provide cleaner data and automated filtering. For most operators, starting with free tools and upgrading only after confirming a positive ROI is the smart move.
How do I reduce false positives in early signals?
Implement a two‑signal confirmation rule: before acting on a trend, require a second independent data source to confirm the same pattern. Also, avoid reacting to one‑day spikes; use a rolling 7‑day average. Over time, you’ll learn which sources are most reliable for your niche.
What’s the ROI of the 60-day prediction advantage?
If your decisions interact—for example, inventory costing reacts to marketing decisions—the compounding effect can multiply ROI by 2–3x per year. If decisions are independent, the advantage is still significant: each early decision yields a 20% better outcome on average. The ROI depends heavily on your decision frequency. For businesses making 4+ strategic decisions per year, the payback period for building the system is typically under six months.
Who should not implement this system?
Solo operators or teams without dedicated analytics time. If you’re already stretched thin, the setup hours (40–80) will likely generate more value elsewhere. Also, avoid this if your organization’s decision cycle exceeds 30 days—the window will close before you can act.
Does the advantage ever disappear?
Yes, if all competitors adopt the same signals, the 60‑day window narrows. To sustain the advantage, you need to continuously upgrade your signal sources—moving from public data to proprietary or niche sources over time.
The Straight Talk
This approach is for operators who manage recurring strategic decisions—product roadmaps, marketing budgets, inventory planning—and see a clear link between timing and outcome. If you make fewer than one major decision per quarter, the compounding math doesn’t apply; the advantage is wasted.
Skip this if your organization cannot execute faster than a 30‑day decision cycle. The 60‑day window will close before you move. And if you’re a solo operator or very small team, the setup cost (40+ hours) will likely deliver better returns elsewhere.
Next action: For your next strategic decision, document the lag between when the signal first appeared and when you acted. If that gap is more than 90 days, work backwards and identify which leading indicator you could have monitored to shorten it.