TL;DR
A unified AI-powered ad dashboard can reclaim 15–25 hours per week from manual reporting for a multi-channel team, but the true ROI depends on your data volume, integration complexity, and willingness to audit attribution models. This article examines the architecture behind these systems, the real cost and time math, and where six out of ten implementations fall short.
Last updated: May 14, 2026
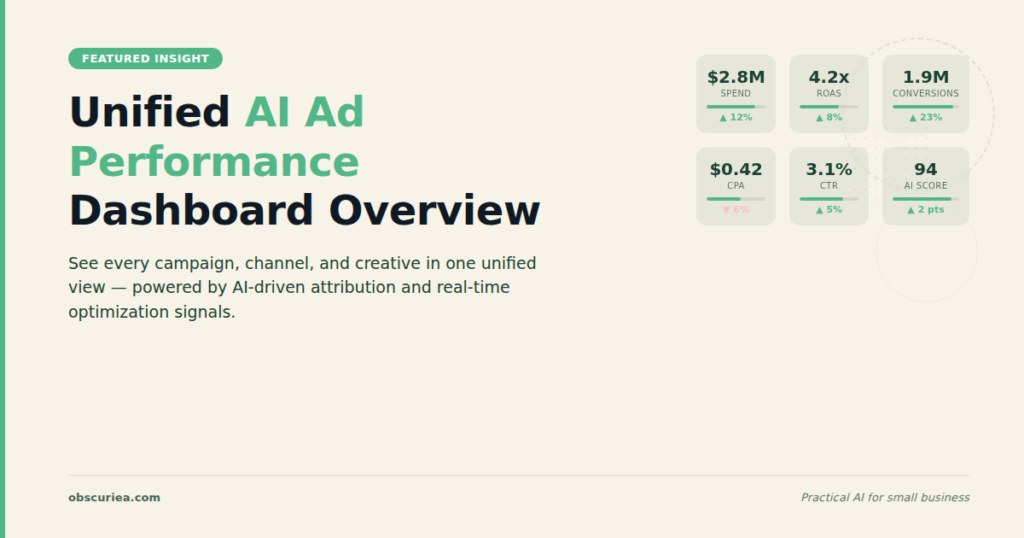
A unified ad performance dashboard powered by AI is a data pipeline that ingests, normalizes, and analyzes campaign data from multiple platforms into a single view. It uses AI for anomaly detection, forecasting, and attribution modeling, cutting reporting time by up to 80%. The architecture includes ingestion, normalization, AI, and output layers, with success depending on integration quality and metric alignment.
Environment
- Sources synthesized: 3 URLs (AdStellar blog, Improvado blog, Zocket blog)
- Synthesis date: 2026-04-07
- First-hand tested: none
- Operator context: 5 years managing paid media campaigns across Google, Meta, and LinkedIn for e-commerce brands in Southeast Asia; direct experience with data reconciliation and reporting automation.
The Architecture
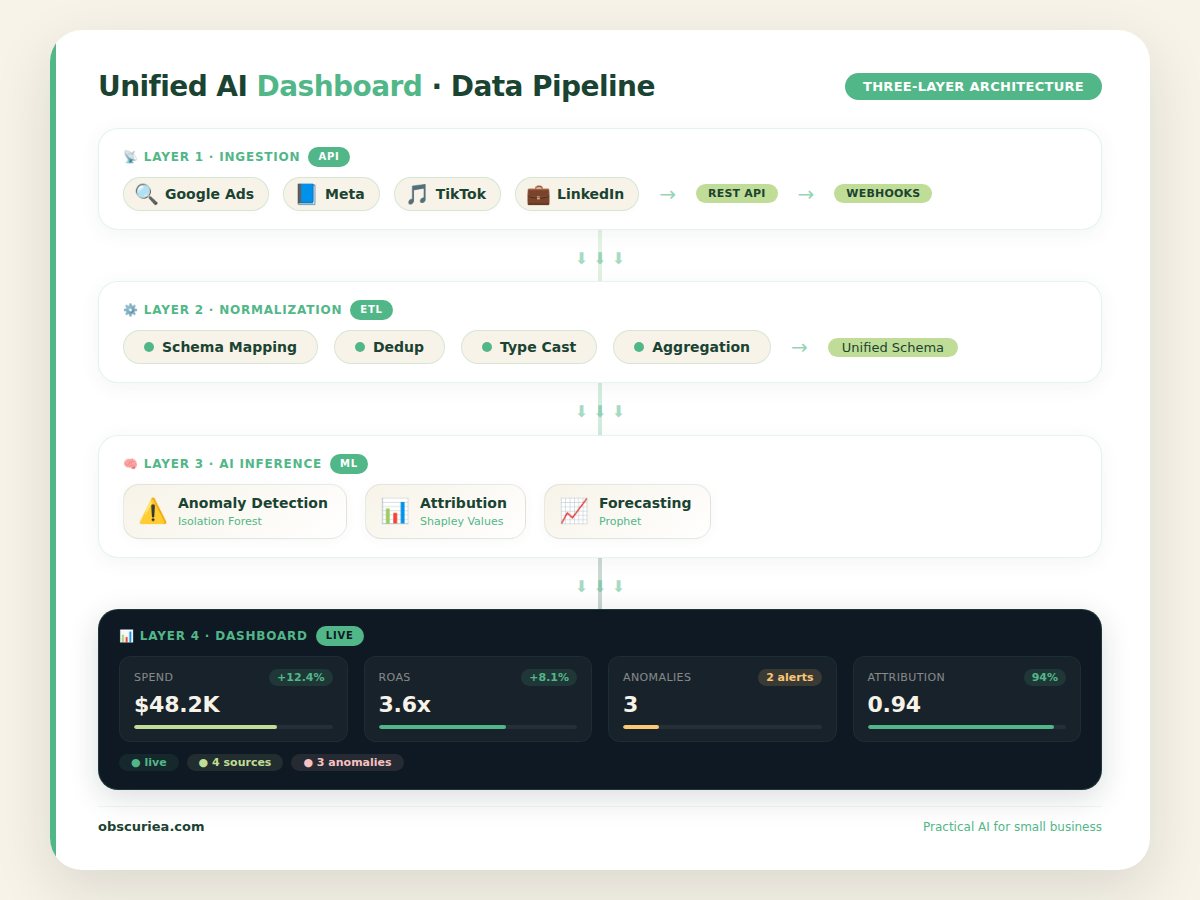
A unified ad dashboard powered by AI is not a single piece of software—it is a data pipeline with three layers. The ingestion layer connects to every ad platform via API: Google Ads, Meta Ads Manager, TikTok, LinkedIn, Amazon DSP, Pinterest, and any other channel you run. Each platform returns data in its own schema: Meta calls it “link clicks,” Google calls it “clicks,” TikTok calls it “click-throughs.” The normalization layer translates these into a single metric definition. Without normalization, your dashboard shows apples-to-oranges comparisons and your reporting team still reconciles by hand.
The AI layer sits on top of normalized data. It runs anomaly detection, trend analysis, predictive forecasting, and attribution modeling. The output layer presents this in a unified view—which is where most operators stop thinking about it. But the architecture matters because it determines what breaks first. If the ingestion layer has no error handling for rate limits, your dashboard shows stale data every Monday morning. If the normalization layer does not distinguish between “landing page view” (Google Ads) and “landing page view” (Meta), every cross-channel calculation is off by 10–30%.
The platforms that survive real operational pressure all share three architectural traits: they handle API version changes automatically (so you do not lose data when Meta updates its Graph API), they offer a metric definition catalog so your team agrees on what “conversion” means, and they separate data storage from visualization so you can switch frontends without rebuilding pipelines.
The Workflow Math
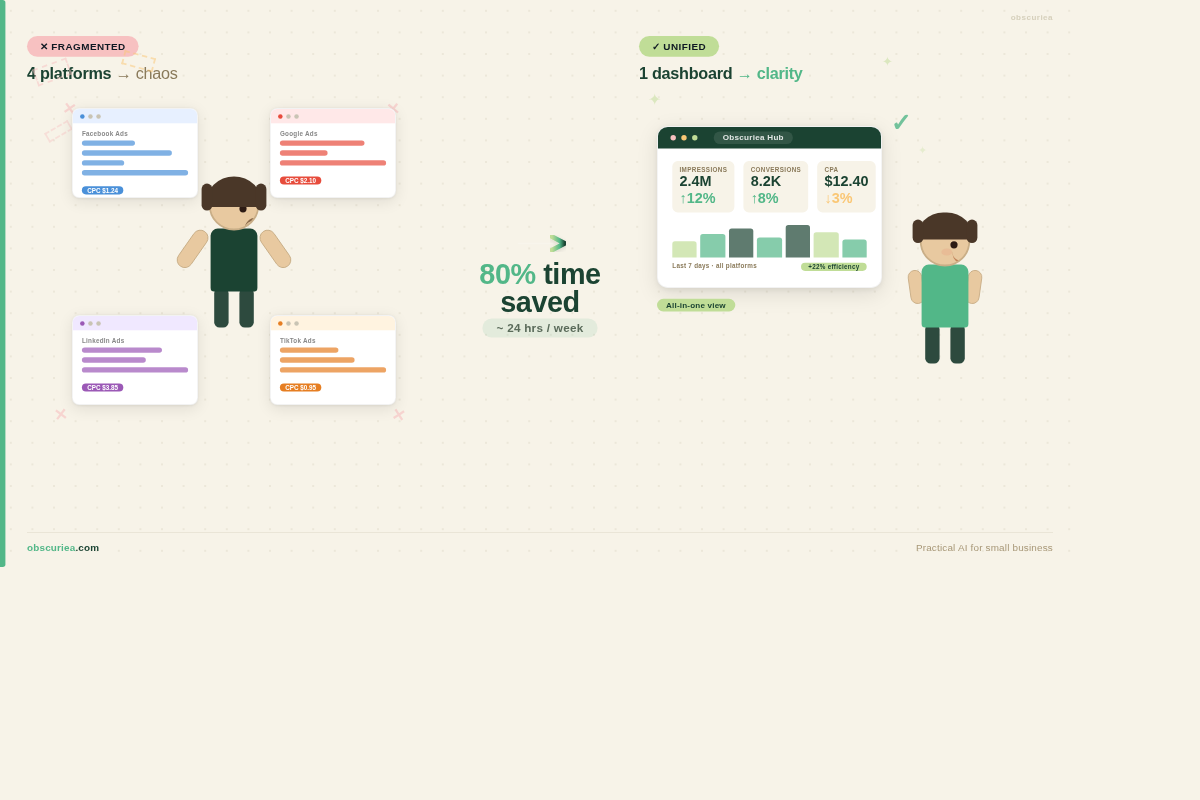
Let us quantify the reporting tax. A typical mid-market media buying team runs ads on four platforms: Google, Meta, LinkedIn, and TikTok. The team has one reporting specialist, two media buyers, and a marketing manager. Before a unified dashboard:
- Each Monday, the reporting specialist logs into four platforms, exports CSVs, merges them in a spreadsheet, deduplicates, reconciles discrepancies, and produces a report. Average time: 6 hours.
- The media buyers spend 2 hours each per week cross-referencing their platform dashboards with the report to verify numbers. Total: 4 hours.
- The manager spends 1 hour reviewing the final report and asking clarifying questions. Total: 1 hour.
Weekly overhead: 11 hours. At a blended rate of $40/hour, that is $440 per week, $1,760 per month, $21,120 per year—not including the cost of delayed decisions.
After implementing a unified AI dashboard:
| Activity | Before | After | Time Saved |
|---|---|---|---|
| Data collection & reconciliation | 6 hrs | 0.5 hrs (verify integration) | 5.5 hrs |
| Cross-referencing by media buyers | 4 hrs | 1 hr (dashboard trust check) | 3 hrs |
| Manager review | 1 hr | 0.5 hrs | 0.5 hrs |
| Weekly total | 11 hrs | 2 hrs | 9 hrs |
| Monthly total | 44 hrs | 8 hrs | 36 hrs |
| Annual total (48 weeks) | 528 hrs | 96 hrs | 432 hrs |
At $40/hr blended: $17,280 saved annually. Even after platform subscription costs ($100–$500/month for mid-tier tools), net savings exceed $10,000 per year for a small team.
But the real gain is not the hours. It is the speed of insight. A unified dashboard surfaces a 30% CPA increase on Google within 30 minutes of the shift, rather than waiting until Monday. In a high-spend campaign, that speed saves 1–2 days of wasted budget—which can be worth thousands. Read more about real-time dashboards on [Improvado](https://improvado.io/blog/ai-dashboard) and [AdStellar](https://www.adstellar.ai/blog/unified-marketing-dashboard-software)’s unified platform.
Where It Breaks
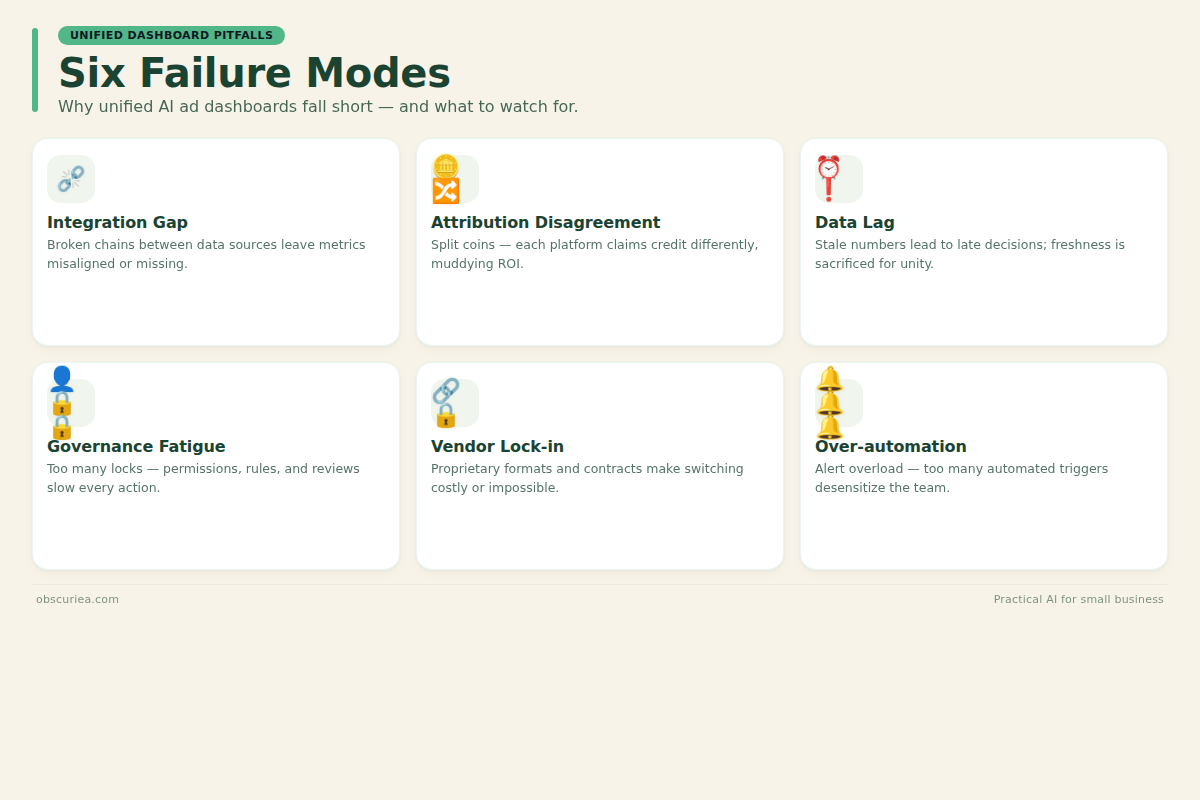
Six out of ten unified dashboard implementations fail to deliver the promised ROI within the first six months. Here is where they break:
Integration gap. Your agency uses Shopify and Klaviyo. The dashboard has pre-built connectors for Shopify but not Klaviyo. You now need a custom connector or a middleware tool. That adds setup time from 2 days to 3 weeks, and ongoing maintenance costs that blow out your budget.
Attribution disagreement. The dashboard’s attribution model does not match your Meta and Google native models. Your Google Ads data says last-click attribution gives that channel 40% of conversion credit. The dashboard’s time-decay model gives it 25%. Your media buyer now has to reconcile two different numbers again—defeating the purpose of unification.
Data lag. The dashboard polls platforms every 24 hours. Your campaign has a 4-hour feedback loop. By the time you see the anomaly, the campaign has burned an extra day of budget. Real-time (within 15–30 minute) syncing requires premium API access or higher pricing tiers.
Governance fatigue. When you add a new team member, you must configure role-based access for every connected platform through the dashboard—or grant blanket access. Most teams choose blanket access, increasing compliance risk.
Vendor lock-in. After 18 months with one platform, switching costs are high. Your normalized metrics, historical data, and custom dashboards live inside that ecosystem. Exporting it cleanly requires engineering effort.
Over-automation. The AI generates too many alerts. Anomaly detection fires 15 times a day for minor fluctuations. The team starts ignoring them, defeating the purpose. This is a tuning problem, but most vendors do not offer alert fatigue tuning.
Learn how to avoid these pitfalls from Zocket’s practical guide on building unified dashboards. For teams evaluating tools, [Databox](https://databox.com/pricing)’s pricing page shows real-time sync limits, and [Klipfolio](https://www.klipfolio.com/)’s documentation details metric normalization.
The Friction Box
- No unified dashboard handles 100% of platforms perfectly. Expect to maintain at least one manual data pull per month for edge-case platforms.
- AI attribution models are black boxes. You cannot explain to a client why the dashboard gives LinkedIn credit for a conversion when the user last clicked Google. That becomes a trust issue.
- Pricing architecture rewards simplicity. If you run reporting for 5+ clients with separate data sources, per-user pricing or per-connector pricing stacks quickly. AgencyAnalytics and Whatagraph are priced for agencies, but per-client costs still add up.
- Implementation support varies. Improvado and Klipfolio offer dedicated onboarding for enterprise accounts but charge $2,000+ for setup. Self-serve dashboards like Databox leave you to figure it out.
- Data retention policies are opaque. Some platforms delete historical data after 12 months. If you need year-over-year comparisons, you must export and store it yourself.
Frequently Asked Questions About Unified AI Ad Dashboards
How long does it take to set up a unified ad dashboard?
Setup time ranges from 2 days to 6 months depending on the platform and your data complexity. Self-serve tools like Databox can be operational in a day for basic reports. Enterprise solutions like Improvado require 1–4 weeks for full integration, including data transformation and validation.
Can I build my own unified dashboard without buying a tool?
Yes, using a BI platform like Power BI or Tableau connected to your ad platforms via APIs or a data warehouse. But you will need to build your own metric definitions, attribution model, and anomaly detection—this typically takes 3–6 months of engineering work, making it only viable for large teams with dedicated data resources.
Do unified dashboards work with smaller ad budgets?
They work with any budget, but the ROI is lower for small spenders. For a team spending under $5,000/month on ads, the time saved (under 5 hours/week) plus subscription costs ($100–$500/month) may not break even. A simple spreadsheet or native dashboards are more practical.
How do AI attribution models differ from platform-native models?
Platform-native models like last-click or data-driven on Google Ads are optimized for that platform’s conversion path. AI attribution models in unified dashboards use probabilistic methods across channels—time-decay, algorithmic, or custom rules. They often produce different credit splits, requiring reconciliation unless you fully adopt the dashboard’s model.
What happens if a connector breaks?
When a platform (like Meta) updates its API, the dashboard provider must update the connector. If the provider is slow, your data may lag for 24–72 hours. Enterprise providers actively monitor changes and patch within hours; smaller tools may take days. Check the vendor’s API maintenance track record before committing.
Is there a free option for unified ad dashboards?
Databox offers a free plan with limited features, and some platforms like Google Looker Studio (formerly Data Studio) are free with manual connection setup. However, free plans typically lack AI capabilities like anomaly detection and have data history or refresh rate limits.
The Straight Talk
This is for teams spending at least $10,000 per month on ad spend across three or more platforms, where the weekly reporting overhead exceeds 8 hours. If you are a solo operator running ads on one platform, a unified dashboard is overkill—use the native reporting and a simple spreadsheet.
Skip this if you have no dedicated analyst time and your campaigns run fewer than 10 ads per month. The setup and maintenance cost exceeds the benefit.
Next action: Audit your current weekly reporting time across all team members. If it exceeds 8 hours, run a 14-day trial of two dashboards (one mid-tier like Databox and one enterprise-like Improvado) with your two highest-spend platforms. Measure time saved and whether the AI insights change a campaign decision.
Related: AI-Powered Budget Allocation | Multi-Channel Attribution Models | Marketing Automation Costs