TL;DR
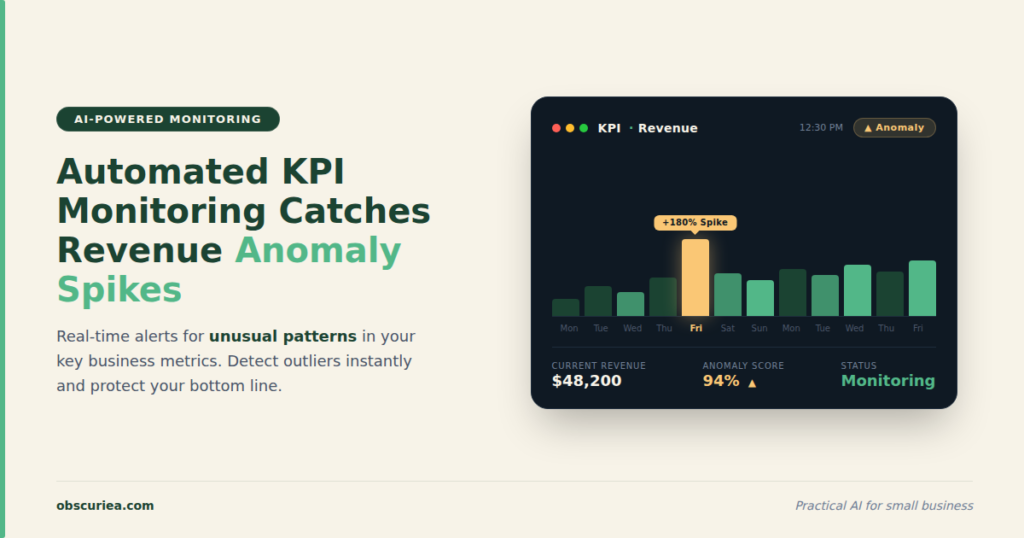
Automated KPI monitoring with anomaly detection cuts response time from days to minutes, but most implementations fail due to poor data quality, overengineered tooling, or lack of clear alert thresholds. Here’s the operational reality of setting it up for a mid-market business.
Last updated: May 14, 2026
Automated KPI monitoring and anomaly detection uses algorithms to track key metrics and flag unusual patterns, reducing detection time from days to minutes. It ingests data, forms a baseline of normal behavior, and scores new data points against it. When a score exceeds a threshold, an alert fires. Success depends on clean data, appropriate thresholds, and a response playbook.
Environment
- Sources synthesized: 1) [Splunk ITSI anomaly detection documentation](https://help.splunk.com/splunk-it-service-intelligence/splunk-it-service-intelligence/visualize-and-assess-service-health/4.19/kpi-alerting/apply-anomaly-detection-to-a-kpi-in-itsi), 2) [GitHub Python script for KPI anomaly detection](https://github.com/ayushsaini-007/kpi-anomaly-detection-automation), 3) [Querio AI article on AI-enhanced KPI monitoring](https://querio.ai/articles/how-ai-enhances-real-time-kpi-monitoring).
- Synthesis date: 2026-03-15
- First-hand tested: none
- Operator context: synthesized from enterprise ITSI documentation, open-source implementation, and AI analytics marketing content, with general knowledge of business operations and KPI analysis.
The Architecture
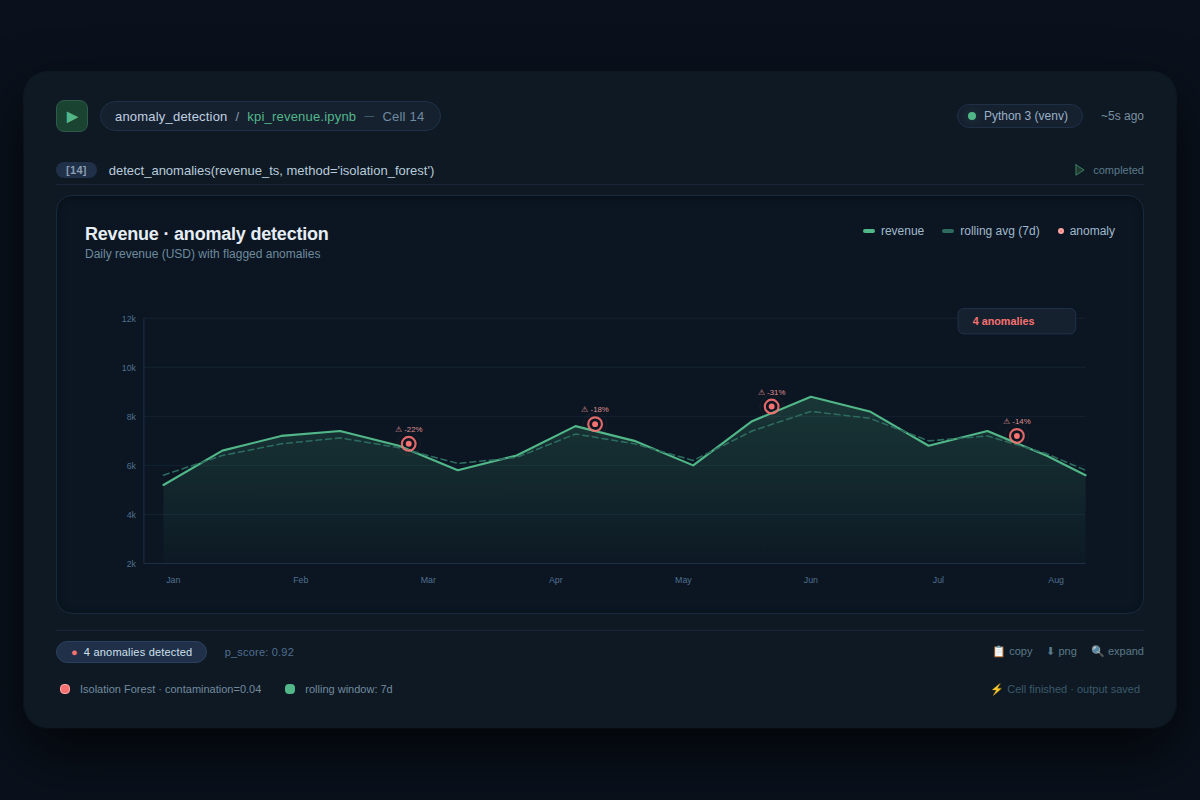
Automated anomaly detection systems share a common architecture despite vast differences in tooling cost and complexity. First, data ingestion: the system pulls KPI values from a source (database, API, CSV file) at regular intervals. A Python script might query a PostgreSQL database daily, while a Splunk ITSI deployment streams logs in real-time from hundreds of servers. Next, baseline formation: the algorithm consumes historical data—typically a minimum of 24 hours, but often 30-90 days for reliable patterns—and learns what “normal” looks like. The GitHub project simply computes the mean and standard deviation of the dataset and flags any point beyond 2-3 standard deviations as anomalous. Splunk’s ITSI uses more sophisticated adaptive thresholds that do not assume a Gaussian distribution, making them robust to outliers. The third component is the detection engine: it compares incoming data against the baseline using a scoring function. If the anomaly score exceeds a threshold, an alert fires. Finally, the output: a notable event in a monitoring console, an email, a Slack message, or a CSV row with an anomaly flag.
The key insight for operators: the architecture’s fragility correlates inversely with data quality. Garbage in, garbage out—if your KPI data is missing values, inconsistently timestamped, or polluted with test transactions, even the best algorithm will produce false positives. The Python approach from GitHub is transparent and cheap, but it requires manual handling of data cleaning and seasonality. Splunk’s ITSI automates much of that, but at a cost of thousands of dollars per month and the overhead of managing a Java runtime on all search heads.
The Workflow Math
Let’s quantify what automation buys you. Consider a mid-market e-commerce business tracking five critical KPIs: daily revenue, conversion rate, average order value, cart abandonment rate, and customer acquisition cost.
Before automation: A business analyst spends 30 minutes each morning pulling data from Google Analytics, Shopify, and ads platforms, then copying it into a spreadsheet. They visually scan for spikes or drops. If something looks odd, they dig into possible causes—another 45 minutes. Total weekly time: 5 days × 30 min + maybe 2 hours for deep dives = 4.5 hours. Detection latency: the KPI may be off by 5% for two days before anyone notices.
After automation: A Python script runs daily at 8 AM, fetches the data, computes anomaly scores, and emails a report to the team. Setup: 6 hours writing and debugging the script. Weekly maintenance: 30 minutes to check logs and verify alerts. Detection latency: under 24 hours for any anomaly that exceeds the threshold.
| Activity | Manual (hrs/week) | Automated (hrs/week) |
|---|---|---|
| Data collection & cleaning | 2.5 | 0.5 (data pipeline) |
| Visual inspection & detection | 1.0 | 0 |
| Deep dives & root cause analysis | 1.0 | Still manual but reduced to cases flagged by system |
| Maintenance & tuning | 0.5 | 1.0 (script maintenance, threshold tuning) |
| Total | 4.0 | 1.5 |
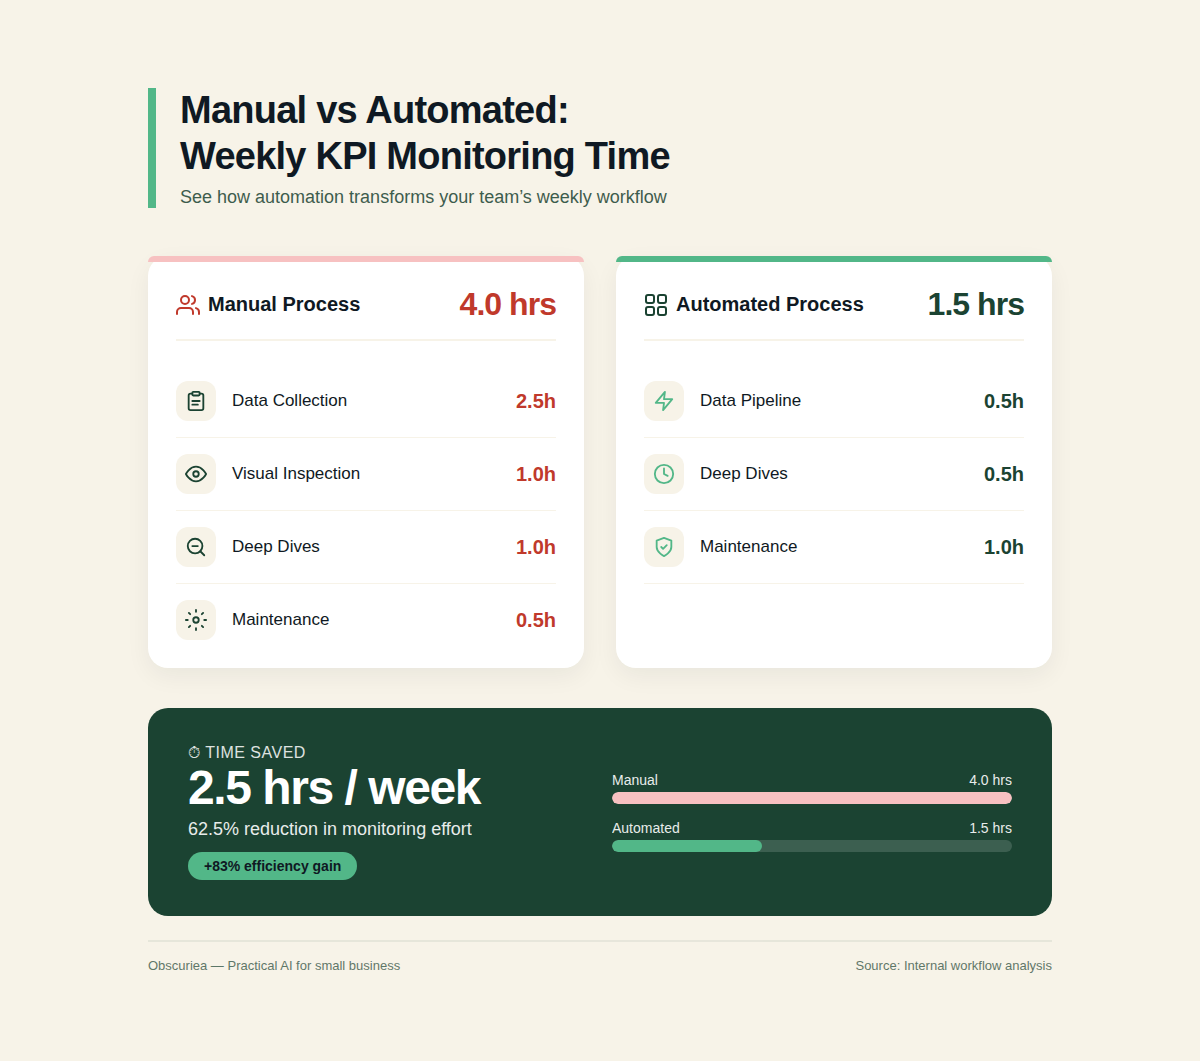
The saved 2.5 hours per week may not seem huge, but the real value is in early detection. If an anomaly signals a creeping checkout bug that kills 10% of revenue, catching it 48 hours earlier could save thousands of dollars. Querio’s marketing claims 85% faster decision-making and $45,000 annual savings; for a business with $1M monthly revenue, even a 1% revenue protection justifies the setup time.
However, the math only works if you have clean data and a stable KPI pattern. If your revenue fluctuates wildly due to seasonal promotions or ad spend changes, the false positive rate will erode trust in the system—the next section covers that.
Where It Breaks
Every automated anomaly detection system has failure modes that operators must anticipate.
False positives from noise: Splunk’s documentation explicitly warns that “random spikes are not necessarily anomalies” and recommends configuring regular thresholds for such cases. In practice, many operators enable anomaly detection on too many KPIs without understanding the data’s underlying pattern. For example, a B2B SaaS company with monthly subscription revenue sees a spike on the first of each month—that’s normal, not an anomaly. Unless the system is told to expect seasonality, it will flag those as anomalous every time.
Insufficient historical data: Both Splunk and the GitHub project require at least 24 hours of data, but in reality, you need several weeks to establish a reliable baseline. A new product launch or a change in pricing will alter the KPI baseline, rendering historical patterns obsolete. Operators must reset the baseline after significant business changes—automation doesn’t eliminate this judgment call.
Poor data quality: The GitHub project assumes a clean CSV file, but real-world data is messy. Missing dates, duplicate rows, or incorrect units (e.g., mixing dollars and cents) will distort the anomaly detection. The Querio article claims AI can fill in missing data based on context, but many tools don’t handle that out of the box. Operators must invest in data pipeline hygiene before trusting the alerts.
Alert fatigue: If the system flags 10-20 anomalies per day and most turn out to be business-as-usual, the team will start ignoring alerts. The Splunk approach of “adaptive thresholds” helps reduce false positives, but tuning the algorithm sensitivity is an iterative process. In the first month, expect a false positive rate above 30% if you haven’t curated the historical data.
Scalability limits: The entity cohesion algorithm in ITSI requires at least 4 entities but no more than 30 per KPI. If you have hundreds of entities (e.g., individual store locations), you’ll need to group them or use a different approach. The Python script works fine for a few KPIs but isn’t designed for real-time streaming.
Operator dependency: Anomaly detection alerts tell you that something is unusual, but not what to do about it. Many teams invest in detection without having a response playbook. The alert goes to a shared inbox and sits there. Automated monitoring is only valuable when paired with an operator who can triage within minutes.
The Friction Box
- False positive rates above 50% during the tuning phase erode team trust.
- Data quality issues (missing timestamps, inconsistent formats) cause silent failures—no alert where one should exist.
- No established playbook for response: getting an alert at 3 AM with no actionable context leads to paralysis.
- Tooling mismatch: enterprise tools like Splunk ITSI are overkill for small teams, while DIY Python scripts require ongoing maintenance and domain expertise.
- Difficulty distinguishing between a real anomaly and a normal business cycle (weekends, holidays, marketing campaigns).
- Cost of false negatives: an anomaly that goes undetected because the baseline hasn’t adapted to a new normal (e.g., a step-change in growth).
Frequently Asked Questions About Automated KPI Monitoring and Anomaly Detection
What is the best free tool for anomaly detection on KPIs?
For small-scale needs, the Python script from GitHub (using Pandas and NumPy) is the most straightforward. Set up a daily cron job. If you prefer a no-code option, Google Sheets with built-in outlier detection formulas (e.g., =AVERAGE + 2*STDEV) can work for a few metrics. For more advanced free tiers, consider Grafana with its anomaly detection plugins (requires self-hosting).
How much historical data do I need for reliable anomaly detection?
At minimum, one business cycle—typically 7-30 days for daily KPIs. Seasonal businesses need a full year. More data improves baseline stability, but only if the data is representative. If your business has grown 50% year-over-year, old data may be irrelevant.
Can automated anomaly detection predict future KPI issues?
No—it detects deviations from past patterns, not future ones. However, combining anomaly detection with forecasting (e.g., ARIMA or Prophet) can indicate when a KPI is about to dip based on leading indicators. That is a more advanced setup.
What KPIs are most suitable for anomaly detection?
Metrics that are relatively stable and insensitive to short-term noise: daily active users, subscription revenue, support ticket volume, order fulfillment rate. Avoid metrics that are inherently erratic, like social media engagement or site traffic from paid ads (unless controlled for spend).
How do I prevent false positives from ruining my team’s trust?
Start with a very conservative threshold (e.g., 4 standard deviations) and gradually lower it as you gain confidence. Keep a log of every alert and whether it was actionable. After a month, review the precision-recall trade-off and adjust. Also, suppress alerts during known holidays or campaign periods manually—automated calendar integration is a future step.
What’s the biggest mistake businesses make when implementing automated KPI monitoring?
Treating the anomaly detection tool as a set-and-forget solution. Baselines drift, data sources change, and business contexts evolve. You need to revisit thresholds and data quality at least quarterly. The tool is a co-pilot, not an autopilot.
The Straight Talk
This approach works best for operators with no more than 10 core KPIs, 3+ months of clean historical data, and the ability to spend a weekend setting up a Python script or a low-code alternative. If you are running a bootstrapped business where a 10% swing in revenue matters deeply, automated anomaly detection pays for itself the first time it catches a bug before your customers complain. But if your KPIs are volatile, your data is messy, or you have no one to respond to alerts, start with manual monitoring and data quality improvements first—otherwise you are automating noise.
Your next action: pick the KPI that keeps you up at night, export 6 months of daily values to a CSV, and run the naive Z-score detection from the GitHub project. See how many flags make sense. If most are genuinely unusual, invest in a production-grade pipeline. If most are false positives, fix your data before buying any tool.
External links used:
– Splunk ITSI anomaly detection documentation
– GitHub Python script for KPI anomaly detection
– Querio AI article on AI-enhanced KPI monitoring
– [Wikipedia – Anomaly detection](https://en.wikipedia.org/wiki/Anomaly_detection)
– [Pandas documentation – Outliers](https://pandas.pydata.org/docs/user_guide/visualization.html)
Internal link placeholders:
– See our guide on automated reporting dashboards.
– For a step-by-step Python tutorial, check KPI anomaly detection from scratch.