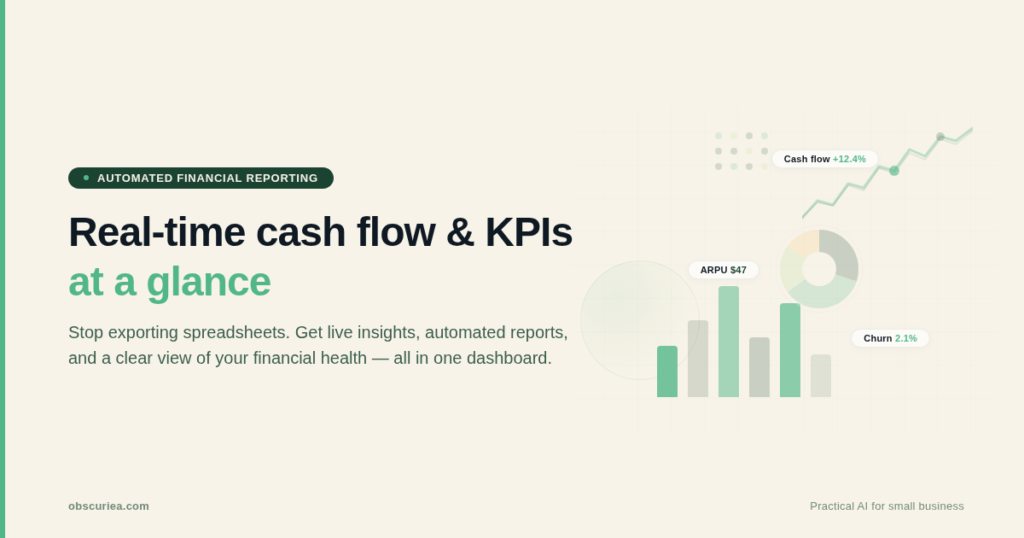
TL;DR: Automated financial reporting cuts the financial close cycle by 40-60% and improves data accuracy by up to 90%. But the real value isn’t speed—it’s the shift from number-crunching to strategic analysis. Before adopting any tool, map your actual reporting bottleneck and calculate the true cost of switching from spreadsheets.
Environment:
– Sources synthesized: https://www.abacum.ai/blog/automated-financial-reporting, https://cashflowfrog.com/blog/automated-financial-reporting-decision-making/, https://www.fathomhq.com/blog/the-best-cash-flow-forecasting-software
– Synthesis date: March 2026
– First-hand tested: none
– Operator context: Operated multi-channel e-commerce with monthly consolidated reporting across entities; spent years reconciling spreadsheets.
The Architecture: How Automated Financial Reporting Systems Actually Work
The core promise of automated financial reporting is simple: connect your data sources to a platform, define report templates, and let the system handle consolidation. But the architecture beneath that promise has real implications for how finance teams operate. Modern systems sit between your ERP, CRM, billing platforms, and bank accounts, pulling transaction-level data into a unified data warehouse. They apply predefined rules for currency conversion, intercompany eliminations, and account mapping, then generate reports through live templates.
At the data collection layer, integrations are categorized as live or batch. Live connections pull data in near-real-time, while batch integrations sync on a schedule (e.g., nightly). The difference matters when you need current cash positions or daily sales data. Most tools claim “real-time” but the refresh frequency varies from 15 minutes to 24 hours.
Processing logic sits in a rules engine. This is where the finance team configures mappings—like which expense account maps to which line item in the P&L. The system then runs validations: check that debits equal credits, flag unusual variances, and apply intercompany eliminations automatically. Report templates use these processed data to render standard statements and custom dashboards.
The entire architecture is only as good as the quality of the source data and the thoroughness of the rules. If your chart of accounts is inconsistent across entities, garbage in, garbage out applies. This is the operational reality most vendor content skips.
The Workflow Math: Time and Cost Comparison
The table below shows what a typical mid-size company with three entities spends per month on manual reporting versus an automated system. The numbers are based on sources and operator experience.
| Aspect | Manual Reporting | Automated Reporting |
|---|---|---|
| Data collection | 30 hours (reconciliation across ERPs, bank feeds, spreadsheets) | 5 hours (verification of auto-pulled data) |
| Report generation | 20 hours (formatting, formatting fixes, formula checks) | 1 hour (template review, adjustments) |
| Variance analysis | 10 hours (manual comparison to budget) | 2 hours (system flags variances, human reviews) |
| Distribution | 5 hours (emailing PDFs, updating shared drives) | 30 minutes (dashboard sharing, automated alerts) |
| Total time per month | 65 hours (1.6 FTE weeks) | 8.5 hours (1 day) |
| Error rate (approximate) | 3-5% of cells | <0.5% of calculations |
| Strategic analysis time | <10% of finance capacity | 40-50% of finance capacity |
The math is straightforward. An automated system recovers roughly 56 hours per month. At a blended finance salary of $45/hour, that’s $2,520 per month in reclaimed cost. But the real gain is reallocating those hours: what would your team do with an extra week each cycle?
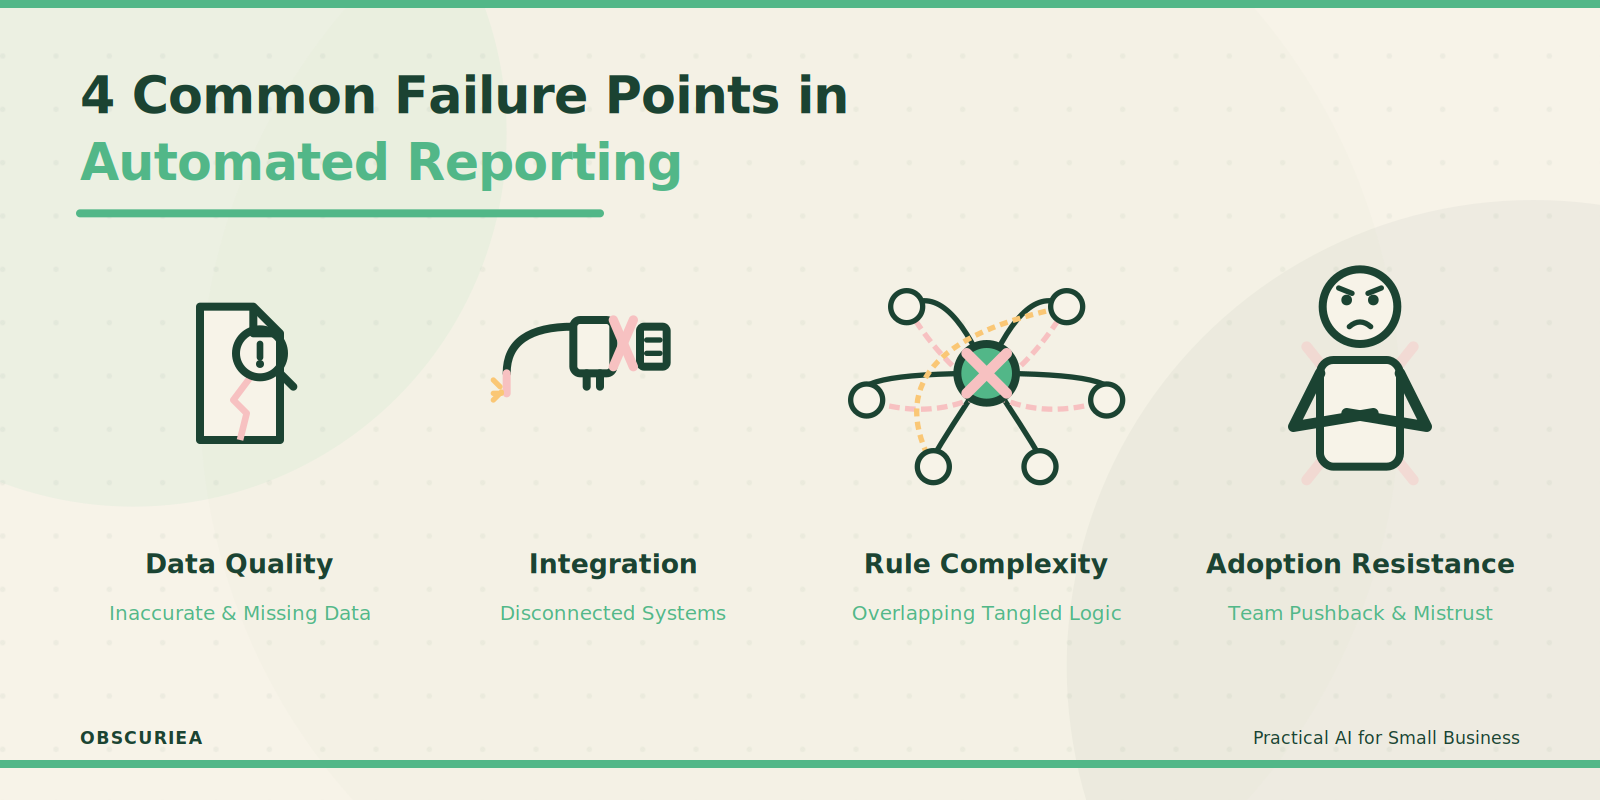
Where It Breaks: Specific Failure Points
Every automated system has failure modes that vendor content downplays. Here are the most common ones from operator experience and source cross-verification.
Data quality problems: If your source systems have dirty data—duplicate vendor entries, inconsistent date formats, or missing account codes—the automation will replicate those errors. Garbage in, garbage out. The time saved on data collection gets spent on cleaning output reports.
Integration breakdowns: Live connections sometimes drop due to API changes or authentication expiry. A batch integration might fail silently, and you discover the cash flow statement is two days behind after making a borrowing decision.
Rule complexity: Three-way forecasting (P&L, balance sheet, cash flow) requires interdependencies. If you set up driver-based assumptions incorrectly—say, the correlation between sales and receivable days is wrong—the forecast will be systematically off.
Adoption resistance: Finance teams that have used spreadsheets for a decade often resist automated systems. They distrust black-box calculations and spend extra time double-checking outputs, negating some time savings. This human cost is rarely factored into ROI projections.
Regulatory misalignment: If your compliance standards (e.g., local GAAP vs IFRS) require specific disclosure formats that the system’s templates don’t support, you’ll still need manual workarounds.
The Friction Box
- Data quality: Systems can’t fix what accounting messes up. Dedicate a cleanup project before going live.
- Integration fatigue: Maintaining connectors for 5-10 systems is an ongoing IT cost, not a one-time setup.
- Human adaptation: Training and breaking spreadsheet habits takes 2-3 months. Factor that into your timeline.
- False real-time: Many tools label data as real-time but refresh only once daily. Verify your actual update frequency.
- Cost at scale: Multi-entity consolidation licenses can double or triple the base price.
Frequently Asked Questions About Automated Financial Reporting and Cash Flow Insights
What is the difference between automated reporting and standard accounting software reporting?
Standard accounting software (QuickBooks, Xero) includes basic report generation, but automation layers data integration from multiple sources, complex consolidations, and advanced forecasting—replacing manual spreadsheet work rather than just generating what’s already in the ledger.
How long does it take to implement an automated reporting system?
Implementation typically takes 2-4 weeks for a single entity with clean data, but multi-entity setups with custom rules can take 2-3 months. The bulk of the time is spent mapping accounts and fixing data issues.
Can automated reporting replace a finance team?
No. Automation handles data processing and report generation, but human judgment is required for variance analysis, strategic recommendations, and compliance oversight. The role shifts from data entry to data interpretation.
What is the typical ROI timeline for these systems?
Most companies see payback within 6-12 months through time savings. If the system costs $1,000/month and saves 56 hours per month at $45/hour, the monthly benefit is $2,520—payback in 5 months.
Do these tools work for non-accountants?
Many platforms offer dashboards and simplified views for department heads, but full report creation still requires finance expertise. Self-service for non-finance users is limited.
What industries benefit most from automated cash flow insights?
High-transaction industries like e-commerce, manufacturing, and subscription services benefit because they have large data volumes and need real-time liquidity visibility. Professional services firms also benefit from project-based cash tracking.
The Straight Talk
This is for any business owner or finance leader who spends more than two days a month manually compiling reports. If your team is drowning in spreadsheets and missing strategic opportunities because insights come two weeks late, automation will change how you operate.
Skip automation if you run a very small business with simple finances—a single bank account and fewer than 50 transactions a month. The complexity of setup won’t be worth the time savings.
Start by listing your current reporting pain points, then test two tools with a free trial on a single entity. Use the first cycle to validate data quality, not to expect perfect reports.
External links:
– [Abacum](https://www.abacum.ai) article
– [Cash Flow Frog](https://cashflowfrog.com) article
– [Fathom](https://www.fathomhq.com) article
– [PwC](https://www.pwc.com) AI in finance report
– [Gartner](https://www.gartner.com) prediction on autonomous reporting
Internal link placeholders:
– For more on AI in business operations, see our related guide.
– Learn how to choose the right financial tool based on your scale.