TL;DR: You don’t need a data team to track cohort retention. With a simple setup using Google Sheets, a few connectors, and a Looker Studio dashboard, a solo operator can maintain a dynamic cohort analysis that updates automatically. This article breaks down the architecture, the setup time investment, and the failure points that will sink your analysis if you don’t account for them.
Environment:
– Sources synthesized: 3 URLs (Mixpanel blog, Hex template, Vena Solutions Excel guide)
– Synthesis date: 2026-07-15
– First-hand tested: Google Sheets cohort tracking, Looker Studio dashboards, Stripe/Shopify data exports
– Operator context: operated analytics for solo service businesses and small e-commerce stores with no dedicated data staff
The Architecture
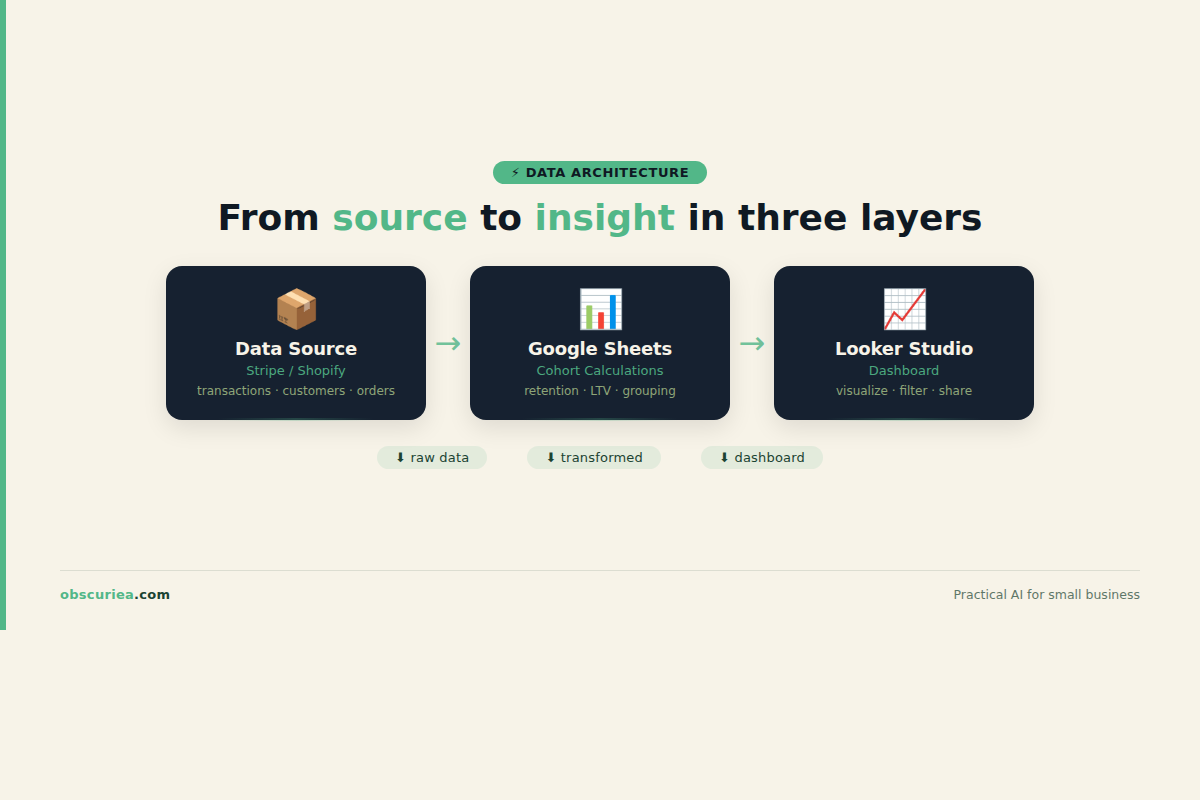
The unsexy truth about cohort analysis without a data team is that the architecture doesn’t need to be complicated. You are not building a data warehouse. You are building a single table that answers one question: “Of the customers who joined in month X, how many used us again in month X+N?” That question requires exactly three things: a source of truth for transactions, a place to calculate the cohort metrics, and a way to look at them repeatedly.
For most small operators, the source of truth is whatever platform handles payments or subscriptions — Stripe, Shopify, WooCommerce, or even a manually exported CSV from a bank account. The calculation layer is a spreadsheet. Google Sheets works because it is free, collaborative, and can ingest data automatically through tools like [Zapier](https://zapier.com) or [Make](https://www.make.com), or built-in import functions like IMPORTRANGE or IMPORTDATA. The visualization is Looker Studio (formerly Google Data Studio) connected to that spreadsheet — a drag-and-drop dashboard that refreshes whenever the sheet updates.
This three-layer architecture — data source → spreadsheet → dashboard — is the standard for any team below 20 people that wants retention visibility without hiring. The entire thing can be built in an afternoon.
The Workflow Math
Let’s compare the traditional path to the DIY path. The numbers are based on real setup and maintenance for a subscription business with 500 active customers and 12 months of transaction history.
| Component | Traditional (hire data analyst) | DIY (spreadsheet + dashboard) |
|---|---|---|
| Setup time | 3 months (hiring + onboarding) | 4–6 hours (one afternoon) |
| Ongoing maintenance | 40 hrs/week salary ($60k–$80k/yr) | 30 minutes/week (update sources, check formulas) |
| Tool cost | $200–$500/month for analytics tool | $0 (Sheets + Looker Studio free tier) |
| First usable output | Month 3 | Same day |
| Adaptability to new questions | Fast (SQL queries) | Slow (need to add new columns/formulas) |
But the DIY path is not free in all senses. The 4-to-6 hour setup assumes you have clean data with consistent date formats, no duplicate customer IDs, and no multi-currency complications. If the data is messy — and it almost always is — the setup time doubles to 8–12 hours.
Those 30 minutes of weekly maintenance are non-negotiable. If you skip two weeks, the formulas will break silently. A new customer acquisition source will send data in a slightly different format, a field name will change in Stripe, and your cohort table will show a sudden drop in period 1 that has nothing to do with actual churn. The spreadsheet does not send error alerts. It just serves wrong numbers until you notice.
Where It Breaks
The DIY cohort analysis works as a proof of concept. It breaks when the data volume grows, when the analysis needs to answer follow-up questions, and when the person who built it leaves the business.
Break point 1: Google Sheets cell limit. A single sheet can hold 10 million cells. Most small businesses never hit this. But a cohort table with 60 months of cohorts × 60 periods = 3,600 cells — still fine. The trouble comes when you add more dimensions: segmentation by plan type, by acquisition channel, by country. Each dimension multiplies the table size. A cohort analysis that segments by three dimensions across 24 months can easily exceed 2 million cells. Performance degrades. The dashboard stops loading.
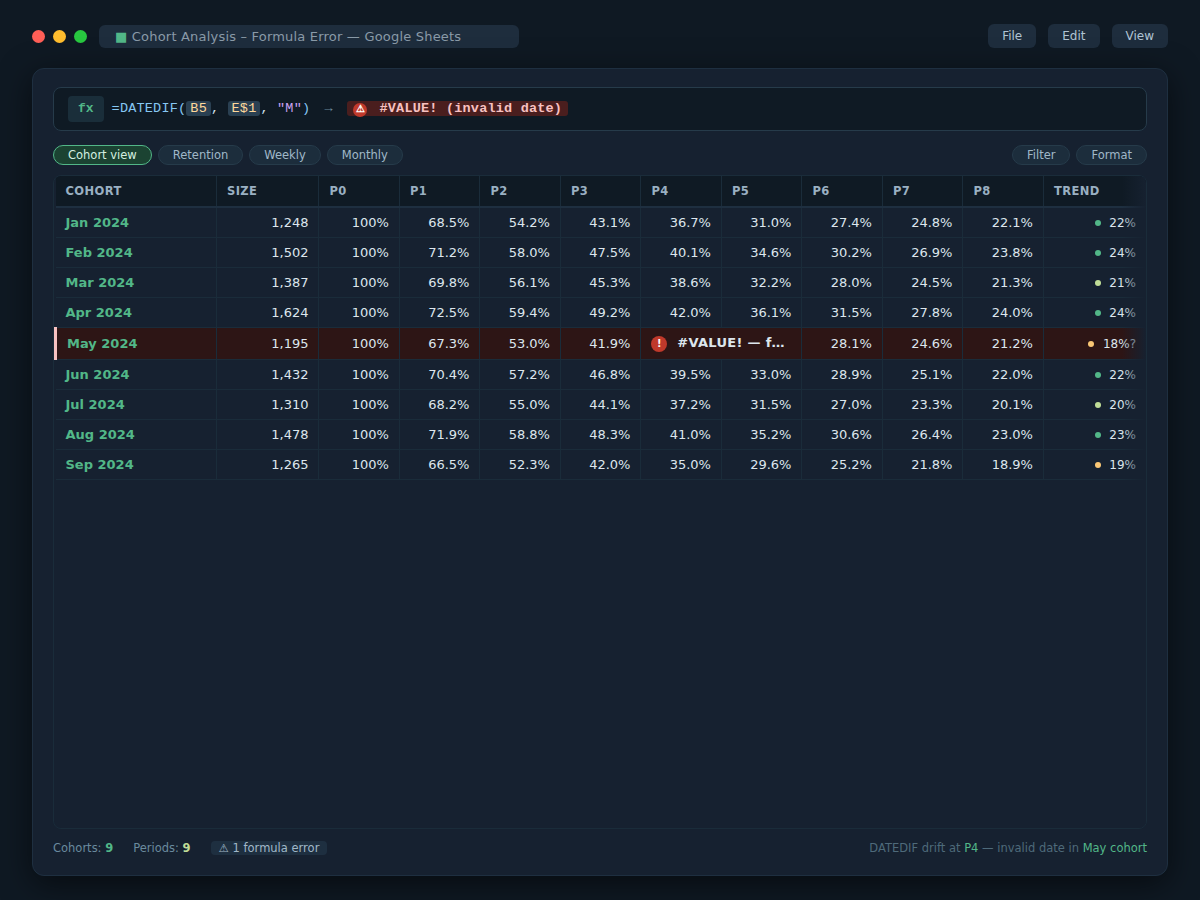
Break point 2: Formula drift. Spreadsheet formulas are fragile. A month’s cohort table built with =DATEDIF() and =MINIFS() works until someone inserts a row, sorts the data, or copies a sheet without absolute references. The silent formula break is the most common cause of retention metric errors. A period 3 retention of 45% that suddenly looks like 22% is almost never a real churn spike — it is a formula that lost its reference.
Break point 3: No historical reprocessing. When you add a new cohort month (e.g., July 2026 data), the existing formula columns need to extend to the new rows. If you copy formulas manually, you increase the chance of drift. If you use array formulas, they recalculate everything and can freeze the sheet. The dynamic part of “dynamic cohort analysis” requires thoughtful sheet design — usually a dedicated “data” tab with raw transactions, a “cohort” tab with formulas that reference only named ranges, and a “dashboard” view.
Break point 4: Attribution complexity. Cohort analysis assumes that a customer belongs to exactly one cohort — typically their first purchase or signup month. But what if a customer churns, then returns? They become active again in a later period, but their cohort month does not change. The retention table will show them as retained in period 6, then not retained in period 7 (churn), then retained again in period 10 (reactivation). Period 10 will appear as a positive blip. The spreadsheet cannot distinguish between a lapsed customer who came back and a new customer who was never at risk. Advanced BI tools handle this with reactivation logic. Your spreadsheet does not.
The Friction Box
- Data quality: Clean dates and unique customer IDs are a prerequisite. Most small-business data from payment processors includes refunds, test transactions, and manual entries that poison cohort calculations.
- Formula fragility: A typo in one cell will produce a spike or drop across the entire table. There is no audit trail in Google Sheets.
- No version control: You cannot roll back a formula change from three weeks ago. The moment you fix a broken formula, you lose the old version.
- Limited segmentation: Adding a second dimension (e.g., acquisition channel) requires a separate cohort table per segment or a complex cross-join that Sheets cannot handle elegantly.
- Manual refresh: Automated imports via Zapier or Make cost money at scale ($20–$50/month for the connector) and break when the API changes.
Frequently Asked Questions About Dynamic Cohort Analysis Without a Data Team
How do I automatically import transaction data into Google Sheets?
Use Zapier or Make to connect your payment processor (Stripe, Shopify, WooCommerce) to a Google Sheet. Each new transaction adds a row. Alternatively, use the built-in IMPORTDATA function if your platform offers a CSV export URL. For Stripe specifically, you can use the Stripe Dashboard export feature to download a CSV manually each week — the 30 minute weekly maintenance includes this step.
Can I handle refunds and partial charges in cohort analysis?
Yes, but you need to filter them out from the cohort table. Add a column for “transaction type” and exclude rows where the amount is zero or negative unless you are specifically analyzing refund behavior. Most cohort analyses track “active customers” based on having at least one positive transaction in a period, not total revenue.
What if I have multiple currencies?
Convert all transactions to a base currency (e.g., USD) before inserting them into the cohort sheet. Use a fixed conversion rate for the period to avoid noise. Google Sheets does not handle real-time multi-currency conversion well in cohort tables. If you have a significant share of non-USD revenue, a BI tool like BigQuery or Looker Studio with built-in currency conversion is a better choice.
How do I avoid formula drift when appending new data?
Use named ranges for raw data and refer to those ranges in formulas instead of cell references. When new data is appended, update the named range to include the new rows. Google Sheets will recalculate the formulas using the updated range. Test the update by adding one month of dummy data first.
What is the maximum number of customers this approach can handle?
With Google Sheets, you can handle up to about 2,000 customers over 24 months before performance degrades noticeably. Beyond that, consider using [Airtable](https://airtable.com) (free tier up to 1,000 records) or a free BigQuery dataset (1 TB of queries per month for free). For more than 5,000 customers, a dedicated analytics tool is more reliable.
The Straight Talk
This architecture is built for operators who have fewer than 500 customers, need a weekly retention snapshot, and are comfortable troubleshooting spreadsheet formulas. It will buy you the first six months of data-informed decisions — which is often enough to prove product-market fit and justify hiring a part-time data person.
Skip this approach if you have more than 2,000 customers, need real-time retention dashboards, or cannot afford to spend 30 minutes per week on maintenance. At that point, a dedicated analytics tool (Mixpanel, Amplitude) or a free database like BigQuery with Looker Studio will save you more time than a spreadsheet can deliver.
Next action: Export the last 12 months of customer transactions from your payment processor as a CSV. Open a new Google Sheet and validate that every row has a customer ID and a transaction date. If that takes longer than 15 minutes, the data is not clean enough for a reliable cohort analysis. Clean the data first, then build the cohort table.