Turning Messy Google Analytics Into Actionable Strategy
TL;DR: GA4 is powerful but messy. The key is to stop chasing vanity metrics and focus on three data points: acquisition channels with real conversion, behavior flows that show drop-off, and revenue attribution. Here’s the framework to go from confusing reports to daily decisions.
Environment: This article is synthesized from Google’s official GA4 announcement and supplemented by practical operator experience with event-based analytics. Sources: 1 URL. Synthesis date: 2026-03-28. First-hand tested: Google Analytics 4 properties managed for small e-commerce stores (2023–2025). Operator context: small business operator running dual-language content and Shopify store.
The Architecture: How GA4 stores data and why it feels clumsy
Universal Analytics died in July 2024. If you are still pulling reports from a CSV you exported before that cutoff, you know something feels off about GA4. The event-based model is not just a privacy adaptation—it is a fundamentally different way to structure data, and it breaks most of what operators got comfortable with.
Open your GA4 property right now. Count how many reports require a secondary click to answer a simple question like “which page had the most engaged sessions last week?” The architecture pushes event parameters, user properties, and custom dimensions. The reporting interface is built for marketers with dedicated analytics teams, not for a solo operator trying to decide whether to double down on Instagram or pull that spend and pour it into Google Ads.
The problem is not that GA4 cannot deliver that answer. The problem is that it hides it behind 4–5 setup steps that most users never complete. The default dashboard shows users, sessions, and page views—the same three numbers you get from any analytics script, including the $5/month you would pay for Fathom or Plausible. The investment of learning GA4 pays off only after you build the custom reports that match your business funnel.
Here is what the architecture actually gives you if you configure it:
- Event-based tracking: every user action is an event. Page views, scrolls, outbound clicks, purchases. No more session-based silos.
- User properties: attributes attached to a user that persist across sessions. Useful for segmenting by logged-in status, subscription tier, etc.
- Custom dimensions and metrics: manual definitions that require planning in advance. Retrofitting is painful.
The architecture is flexible—that is its strength and its trap. Without a clear data structure designed around your funnel, GA4 becomes a firehose of events with no actionable signal.
The Workflow Math: Time to insight
Let me put numbers on the friction. Assume a solo operator or small marketing team with no dedicated analytics person.
| Action | Time | Notes |
|---|---|---|
| Open GA4 and answer “What is my conversion rate this month?” | 2 minutes | Default reporting tab, but you must ensure conversions are configured. Without configuration, GA4 shows 0. |
| Build a custom funnel report showing drop-off between add-to-cart and purchase | 45–90 minutes | Creating an exploration, selecting events, ordering steps. First time setup; subsequent uses are faster. |
| Set up a conversion action for a specific user behavior (e.g., form submit) | 15–30 minutes | If you already use [Google Tag Manager](https://developers.google.com/tag-platform/tag-manager), add tag; if not, you manually define conversion in GA4. |
| Debug a discrepancy between GA4 and Shopify revenue | 2–4 hours | Compare event parameters, check for missing enhanced measurement, verify currency settings. Most common cause: the “purchase” event parameter mapping. |
| Weekly 30-minute report generation | 0 | Can be automated via [Looker Studio](https://lookerstudio.google.com/) (free) or scheduled email reports. Without automation, add 30 minutes/week. |
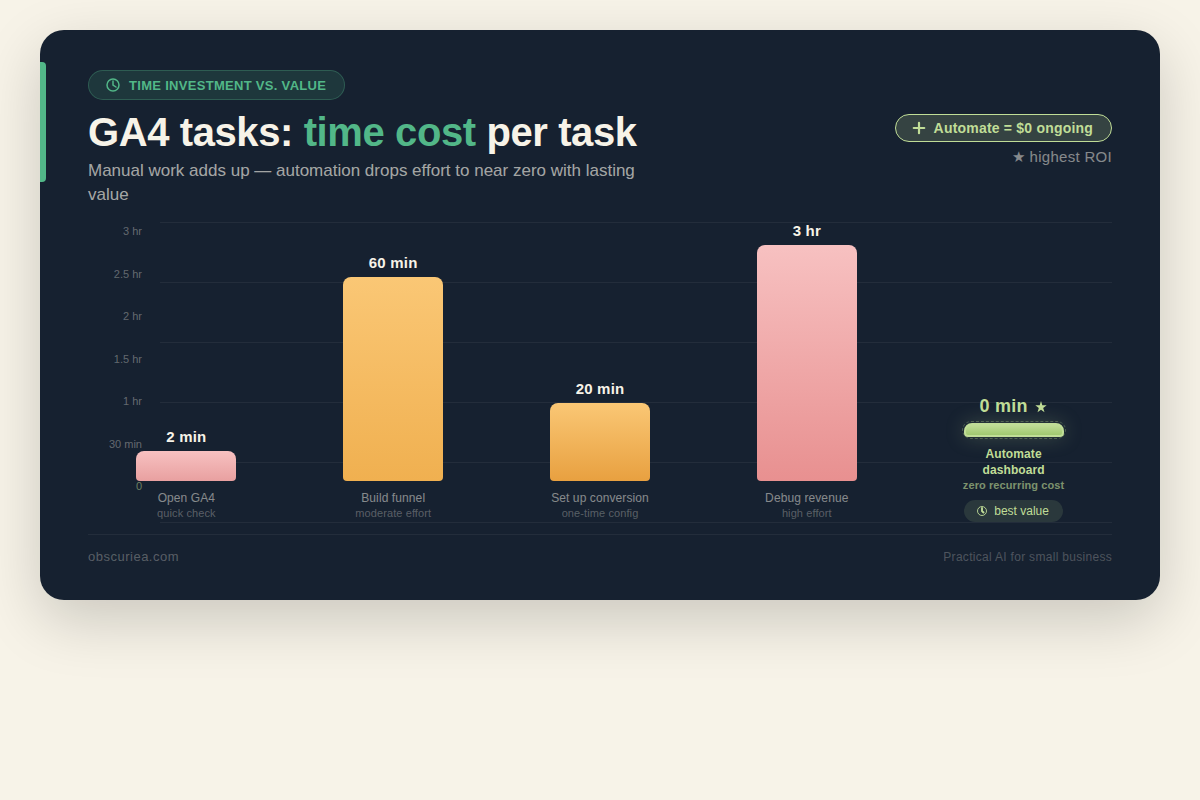
The math: initial setup to get actionable insights (not vanity metrics) costs 6–10 hours for a typical e-commerce store. After that, weekly maintenance is about 30 minutes if you automate dashboards. That is a 2-week payoff if the insights lead to one spending optimization per month.
But here is the truth most guides skip: those 6–10 hours assume you know what you are doing. If you are learning GA4 from scratch, add another 4–6 hours of tutorial time and trial-and-error. The total cost to go from messy data to daily decisions is roughly three full working days for a solo operator.
How does that compare to alternatives? [Fathom Analytics](https://usefathom.com/) gives you a clean dashboard in 5 minutes setup time. You lose the ability to segment deeply and cannot run user-level attribution. For a $5–10/month store, Fathom is likely the smarter choice. For a store doing $5,000+ monthly ad spend, GA4’s attribution and cross-channel data justifies the setup investment.
Where It Breaks: Common pitfalls that turn GA4 into noise
1. Misconfigured conversions
GA4 does not automatically know what a conversion is. You must mark events as conversions. If you skip this, all conversion-based reports show zero. The most common oversight: not enabling “purchase” event as a conversion. GA4 Enhanced Measurement auto-tracks some events, but it does not auto-mark them as conversions. You have to do that manually.
2. Sampling in explorations
Run a report against more than 10 million events in a standard GA4 property? Your data is sampled. Google does not disclose the sampling threshold clearly. Explorations with default settings can produce wildly different numbers depending on when you run them. If you are making budget allocation decisions on sampled data, you are gambling.
3. The timezone trap
GA4 uses the property timezone for daily aggregations. If you run a global store and compare date ranges, midnight splits can cause shifts in session counts. It rarely matters for overall trends, but if you compare day-over-day for a store with heavy late-night traffic in another timezone, Monday’s numbers can look lower than Tuesday’s even though the traffic is the same.
4. Attribution model complexity
GA4 defaults to data-driven attribution (DDA). DDA is generally better than last-click for most businesses, but it is a black box. You cannot inspect why a touchpoint got credit. When you see a channel’s attributed conversion count jump after switching models, you have no way to verify whether the model is correct—only that it is different. For operators who need explainable data, DDA is frustrating.
5. The ramp-up period
GA4 has a ramp-up. Machine learning models for predictive metrics (purchase probability, churn probability) need data to train. A new property can take 2–4 weeks before generating meaningful predictions. During that period, the “insights” GA4 generates are close to random.
The Friction Box
- GA4’s learning curve for solo operators is easily 6–10 hours to get actionable reports running.
- Default dashboard mirrors what a $5 analytics tool shows—value arrives only after custom configuration.
- Sampling in standard properties undermines trust in scale-dependent reports.
- Attribution black box: data-driven attribution cannot be explained, only accepted.
- Timezone and currency mismatches cause silent data errors.
- Historical data from Universal Analytics is gone. No retroactive comparison possible unless you exported.
Frequently Asked Questions About Turning Messy Google Analytics Into Actionable Strategy
Why does GA4 show zero conversions even though I have sales?
This is the most common GA4 frustration. Even if Enhanced Measurement is enabled, you must still mark purchase events as conversions manually. Go to Admin > Events, find the “purchase” event, and toggle the switch under “Mark as conversion.” Give it 24 hours, then check the Realtime report.
How long does GA4 take to start showing reliable data?
For standard reporting (users, sessions, page views), data appears within 24–48 hours. For predictive metrics (purchase probability, churn), allow 2–4 weeks of consistent traffic. Machine learning models need enough historical event data to generate meaningful predictions.
Can I import my old Universal Analytics data into GA4?
No. Google does not allow importing UA historical data into GA4. If you did not export your UA data before the July 2024 shutdown, that data is permanently lost. This is why it’s critical to start fresh with GA4 and set up proper event tracking from day one.
What is the best alternative to GA4 for a small business with low traffic?
For stores with under 500 monthly transactions, consider Plausible or Fathom — both are privacy-first, cost under $10/month, and provide clean dashboards out of the box. You lose funnel analysis and custom segmentation, but for low-traffic sites those tools rarely provide actionable signals anyway.
How do I fix sampled data in GA4?
Sampling occurs when exploration reports process more than 10 million events. Standard GA4 properties cannot eliminate sampling entirely. Workarounds: reduce the date range, use default reports instead of explorations for high-traffic queries, or upgrade to GA4 360 (costs $50,000/year). For most small operators, shrinking the date range is the practical fix.
Why does my GA4 data not match my Shopify or WooCommerce revenue report?
Common causes: currency settings mismatch, missing purchase event parameter mapping, or attribution window differences. GA4 attributes revenue based on last non-direct click, while e-commerce platforms often use first-touch or session-based attribution. Check your GA4 property’s currency setting and the specific purchase event parameters.
The Straight Talk
This is for the operator who is already running GA4, frustrated that they are not getting decisions out of it, and willing to invest the setup time to change that. If your ad spend is under $500/month and you do not need cross-channel attribution, skip GA4 entirely—use Fathom or even your Shopify analytics. The setup time cost does not pay back at that scale.
Here is what to do today: open GA4, go to the admin panel, confirm your purchase event is marked as a conversion. If it is not, mark it. That one action will start making your reports useful. Tomorrow, set up a Looker Studio dashboard for your top 5 marketing channels. Automate it. Stop opening GA4 for daily checks—let the dashboard tell you when something changes, then go diagnose.
For more on building analytics dashboards, see how to automate GA4 reports. If you’re evaluating analytics tools, compare GA4 vs Fathom for small business.