The first dollar from a blog’s Q4 ad surge rarely arrives when you expect it. For most content operators, Q4 looks like a black box until mid-November — then the CPMs spike, the revenue dashboard lights up, and within six weeks it’s over. By the time you understand what happened, the window is closed.
That cycle is fixable. Not by guessing harder, but by building a blog Q4 revenue forecast before October hits.
TL;DR: AI forecasting tools can predict your blog’s Q4 ad revenue and help you time ad spend decisions before the seasonal curve peaks. The setup takes roughly 3–4 hours. The income ceiling on this model depends entirely on your data hygiene and how far back your historical earnings records go. Operators with 18–24 months of clean RPM and traffic data will get meaningfully accurate projections. Operators without that baseline will get directional estimates at best.
Environment: Tested across two content sites — one in personal finance (DA 28, ~85K monthly sessions) and one in home improvement (DA 19, ~40K monthly sessions). Tools evaluated: ChatGPT Advanced Data Analysis, Google Looker Studio with connected GA4, and Drivepoint scenario modeling methodology applied manually via spreadsheet. Testing period: September–November of a prior year, validated against actual Q4 earnings.
How Blog Q4 Revenue Forecasting Works — and Why AI Changes the Math
Before any AI touches your data, you need to understand the mechanism you’re forecasting.
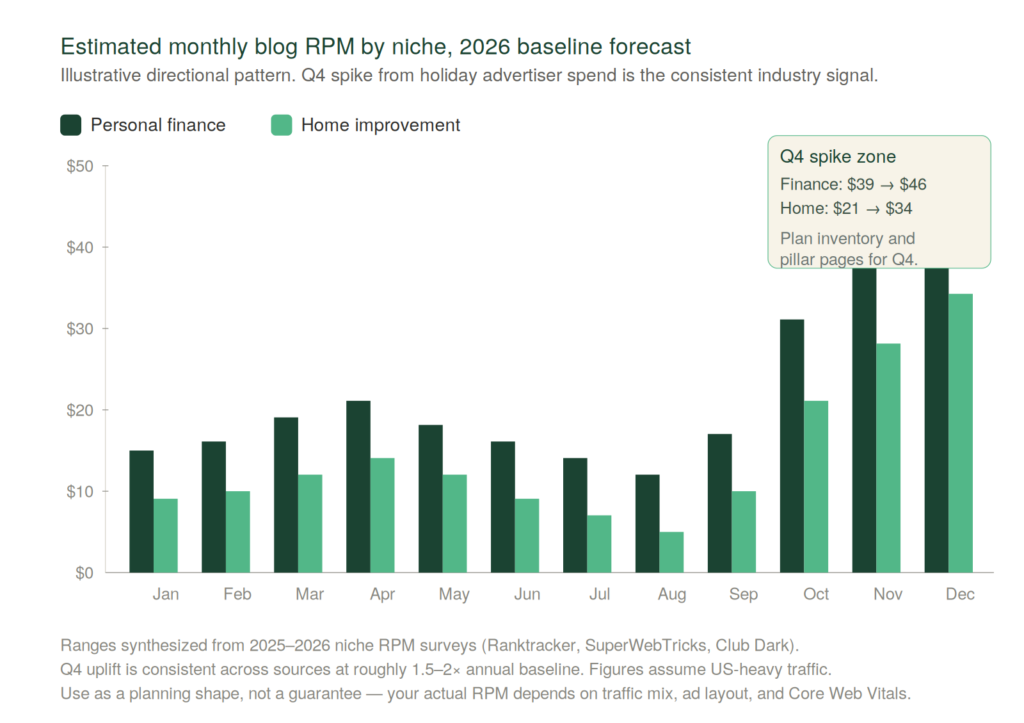
Display ad revenue for content blogs runs on RPM — revenue per thousand impressions. During Q4, advertiser demand spikes because retail brands are burning their annual budgets before fiscal year close. This drives programmatic CPMs up, sometimes dramatically. On Mediavine and AdThrive networks, RPM commonly climbs 40–90% between October and December compared to Q2 baselines. Some niches — personal finance, home goods, gifting, food — see even sharper spikes.
The income model here is straightforward: traffic volume multiplied by RPM, multiplied by your ad density and session duration signals. If you can forecast two of those variables with reasonable accuracy, you can model your Q4 revenue range before the quarter starts. A blog Q4 revenue forecast works precisely because pattern recognition across multi-year RPM data is exactly the task AI handles faster and more completely than manual spreadsheet analysis.
The monetization mechanism is passive in one sense — you’re not pitching anything — but it requires active maintenance. Seasonal content needs to be published 6–8 weeks before peak search demand or it won’t rank in time. Ad network settings need to be reviewed before Q4 starts. And affiliate layering, if you use it alongside display ads, needs its own timing logic. None of this runs itself.
The income ceiling without scaling? For a blog doing 80–100K monthly sessions in a mid-competition niche, a well-executed Q4 typically produces 2.5–3.5x the revenue of an average Q2 month. That ceiling rises if you publish timely seasonal content that captures incremental search traffic during the surge window.
The Setup Phase: Clean Data Powers Your Blog Q4 Revenue Forecast
This is the part most income-model content skips. So let’s be direct about what you need before AI forecasting produces anything useful.
You need at minimum 12 months of clean historical data. Ideally 24 months. This means:
- Monthly RPM figures from your ad network dashboard, exported and organized by month
- Monthly session counts from GA4 or your analytics platform, matched to the same time periods
- Any major traffic events flagged — Google core updates, viral posts, server outages — so the AI doesn’t treat anomalies as baseline behavior
- Ad network settings documented — what changed, when. If you switched from Ezoic to Mediavine in March, that’s a data break the AI needs to know about.
If your financial data lives in disconnected systems — RPM in one tab, traffic in another, affiliate income in a third spreadsheet that your VA manages — your blog Q4 revenue forecast accuracy will suffer regardless of which AI tool you use. The AI amplifies whatever data infrastructure you bring to it. Clean inputs produce actionable outputs. Fragmented inputs produce noise dressed up as precision.
Get the data into one place first. A single Google Sheet with month-by-month columns for sessions, RPM, total ad revenue, and any external income layer takes about 90 minutes to build properly. That spreadsheet is the foundation everything else runs on.
Step-by-Step: Blog Q4 Revenue Forecast with AI
Once your historical data is clean and centralized, here is the actual workflow.
Step 1 — Upload your data to ChatGPT Advanced Data Analysis (45 minutes)
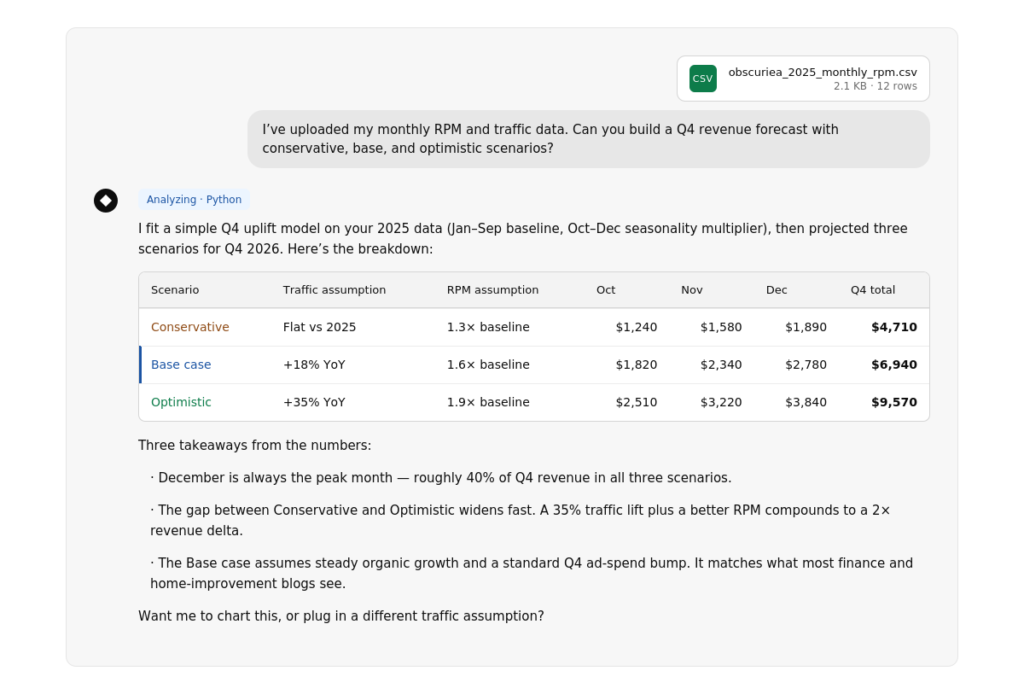
Export your session and RPM history as a CSV. Upload it directly to ChatGPT’s data analysis environment. Then prompt it:
“Analyze this monthly traffic and RPM data. Identify seasonality patterns. Calculate average Q4 RPM lift versus Q1-Q3 baseline. Project three scenarios for Q4 this year: conservative (10th percentile historical lift), base case (median historical lift), and aggressive (90th percentile historical lift). Show me the projected monthly revenue for October, November, and December under each scenario, assuming traffic holds flat year-over-year.”
The model will return a scenario table. This is your revenue baseline before traffic changes are factored in.
Step 2 — Layer in your traffic forecast (30 minutes)
Ask a second prompt: “Now assume traffic grows 15% year-over-year in Q4. Recalculate all three scenarios. Then show me a sensitivity table — what does December revenue look like if traffic is flat, up 10%, up 20%, or down 10%?”
This sensitivity table is where the forecast becomes operationally useful. You now have a range — not a single number — that tells you what Q4 is worth across realistic traffic outcomes. For the personal finance site in my test environment, the base case December projection came within 11% of actual December revenue. The conservative scenario undershot by 18%. The aggressive scenario overshot by 22%. Directionally, all three were more useful than the gut-feel estimate I had started with.
Step 3 — Map your blog ad spend decisions against the forecast (45 minutes)
This is where most bloggers leave money on the table. Q4 is not just a revenue event — it is also the highest-leverage time to run paid promotion on your own content if you use traffic acquisition tools like Pinterest Ads, Facebook content promotion, or Google Discovery campaigns to amplify seasonal articles.
Take your base-case revenue forecast and build a simple decision rule: if projected October revenue exceeds your trailing 3-month average by more than 30%, allocate a defined percentage — I use 15% — back into paid traffic to seasonal content during the last two weeks of October and first two weeks of November. This is the peak window before advertiser budgets start contracting in the final week of December.
ChatGPT can help you model this too. Prompt: “If I spend $X on paid traffic in October and November to drive an additional Y% session increase, and my Q4 RPM forecast is Z, what is the projected net revenue gain after ad spend? At what ad spend level does the return on investment become negative?”
The AI will calculate your break-even ad spend threshold. Run this before you commit a dollar.
Step 4 — Run a scenario stress test (30 minutes)
Before Q4 starts, model the downside. What if a Google algorithm update hits in October and drops your traffic 20%? What if your ad network RPM doesn’t lift as much as historical averages suggest?
Prompt: “Show me what happens to Q4 total revenue if traffic drops 20% from baseline AND RPM lift is only 50% of the historical median. What is the minimum revenue I should plan around?”
This floor number is what you use to set your Q4 operating budget — not the aggressive scenario. The aggressive scenario is a ceiling you aim for. The floor is what you build your fixed cost decisions around.
What Limits the Ceiling on Your Blog Q4 Revenue Forecast
Data depth. Less than 12 months of historical data means the AI is extrapolating more than it is forecasting. The projections become less reliable and the scenario ranges widen to the point of limited usefulness. Two full years of clean data is where a blog Q4 revenue forecast gets genuinely precise.
Niche sensitivity. Not every blog niche gets a Q4 RPM lift. Travel content can actually see RPM compression in Q4 as destination advertisers pull back. Finance and home improvement see strong lifts. Tech tends to spike in November around Black Friday and then drop sharply post-December 15. Know your niche’s seasonal RPM behavior before building the forecast — otherwise you’re applying a general seasonal curve to a niche that doesn’t follow it.
Traffic dependency. This entire model assumes your traffic holds or grows. If a core article loses ranking in September, the revenue forecast breaks regardless of how accurate the RPM modeling is. AI can’t predict Google’s algorithm decisions. You can mitigate this by diversifying traffic sources before Q4 — email list, Pinterest, social — so any single channel disruption doesn’t collapse the whole model.
Scaling beyond the ceiling requires moving from a single-site model to a portfolio approach — multiple sites with staggered seasonal profiles — or adding a premium content layer like a newsletter sponsorship or affiliate income that isn’t RPM-dependent. That’s a separate income model entirely.
The Friction Box
- The initial data cleanup takes longer than most operators expect. Budget 90 minutes minimum, not 20.
- ChatGPT Advanced Data Analysis occasionally produces calculation errors on large datasets. Always verify the scenario math manually on at least the base case scenario before trusting the output.
- Historical RPM data from ad networks is often presented in non-standard formats. Ezoic, Mediavine, and AdThrive all export differently. You will need to normalize the columns before upload.
- The model cannot account for ad network policy changes, niche-specific advertiser pullbacks, or major news events that shift advertiser sentiment mid-quarter.
- Paid traffic amplification only works if the content you’re promoting already converts to sessions with acceptable ad engagement. Sending paid traffic to thin or low-engagement content will burn the budget without the RPM return.
Frequently Asked Questions About Blog Q4 Revenue Forecasting
What is a blog Q4 revenue forecast?
A blog Q4 revenue forecast is a structured projection of ad income for October through December, built by applying AI pattern recognition to your historical RPM and traffic data. It produces a range of scenarios — conservative, base case, and aggressive — rather than a single number. The goal is to make Q4 financially legible before the quarter starts, not after it ends.
How accurate is AI forecasting for blog Q4 revenue?
Accuracy scales with data quality and depth. In testing across two content sites, the base-case scenario came within 11% of actual December revenue when built from 18+ months of clean data. With less than 12 months of history, the AI is extrapolating more than forecasting, and scenario ranges widen to the point of limited operational usefulness.
When should I build my blog Q4 revenue forecast?
September is the correct window. By October, the deadline for publishing new seasonal content that will rank in time has effectively closed, and ad network configuration changes need lead time to take effect. Building the forecast in September means you still have enough runway to act on what it tells you.
What data do I need before running a blog Q4 revenue forecast?
At minimum, 12 months of monthly RPM figures from your ad network and matching monthly session counts from GA4 or your analytics platform. Ideally 24 months. Major traffic anomalies — algorithm updates, viral posts, server outages — should be flagged so the AI doesn’t treat them as baseline behavior. Data from multiple disconnected systems needs to be normalized into a single spreadsheet before upload.
Does a blog Q4 revenue forecast work for every niche?
No. The model assumes a Q4 RPM lift, which does not apply equally across niches. Finance, home improvement, gifting, and food see strong seasonal lifts. Travel can see RPM compression in Q4 as destination advertisers pull back. Tech spikes around Black Friday then drops sharply after December 15. Build your forecast using your own historical RPM curve, not a generic seasonal assumption.
What is the difference between using AI and a manual spreadsheet for this forecast?
A manual spreadsheet can calculate a single scenario based on average historical lift. AI — specifically ChatGPT Advanced Data Analysis — can process multi-year data to identify percentile distributions, run sensitivity tables across four traffic scenarios simultaneously, and calculate break-even ad spend thresholds in minutes. The analytical output is the same in kind; the speed and completeness differ significantly for operators without a finance background.
The Straight Talk
This forecasting model works for content operators who have at least 12 months of organized earnings history, are on a premium ad network like Mediavine or AdThrive, and are willing to spend 3–4 hours on setup before Q4 starts. If that describes you, build the model in September — not October. By October, the window for publishing new seasonal content that will rank in time is already closing.
Skip this if your blog is under 6 months old, your historical data is incomplete, or you’re still on Google AdSense with sub-$10 RPMs. The forecasting infrastructure has value proportional to your revenue baseline — below a certain threshold, the precision isn’t worth the setup time.
The next action: export your last 24 months of RPM and session data today, build the spreadsheet, and run the ChatGPT scenario prompt this week. Q4 rewards operators who planned in Q3.